MADISON Strategic Plan
Part B. Market Analysis
MADISON Strategic Plan
Part B. Market Analysis

May 2018
Prepared by Randall Gross / Development Economics Through a grant from The Memorial Foundation For All Together Madison and the Madison Community
NASHVILLE: 4416 Harding Place, Belle Meade 37205. Tel 202-427-3027 / Rangross@aol.com
WASHINGTON DC: 2311 Connecticut Ave Ste 206 20008. Tel 202-427-3027. Fax 332-1853. Rangross@aol.com AFRICA: African Development Economic Consultants (ADEC). 27-11-728-1965. Fax 728-8371. Randall@ADEC1.com UK: 118 Hampstead House, 176 Finchley Road, NW3 6BT London. Tel 44-79 0831 6890. rangross@aol.com
Section 1. OFFICE MARKET ANALYSIS
This section provides a summary of findings from an Office Market Analysis conducted for Madison as part of this strategic planning process. The market analysis examined existing office market conditions and forecasted the market potentials for office space by type of business and square feet that could be captured by Madison within the competitive market. Based on the findings of this analysis and other inputs, strategic recommendations are provided in the Part C Report on target office tenants and recruitment approaches as part of a broader Madison economic development strategy.
Existing Office Market Conditions
Nashville is a growing office market, with 50 million square feet of office space tracked by the major brokerage houses. Vacancy has increased from a low of about 4% in 2016, mainly because of a supply of new office space finally entering a “starved” market in a growing economy. Absorption (the change in occupancy) has hovered around 1.0 million square feet per year for several years. Rents have escalated rapidly in recent years, due in part to the lack of available Class A space in key sub-markets but also because of demand generated by companies locating to Nashville from more expensive markets like New York or San Francisco. Much of Nashville’s office market is concentrated in three primary nodes – Downtown (25% of the total), Cool Springs (16%), and Brentwood (14%) – although Midtown/Green Hills and the Airport Area also have a significant base of office space. According to Cushman & Wakefield, asking rents for Class A space increased from about $23 per square foot in 2015 to nearly $30 today, an increase of about 30% in just three years.
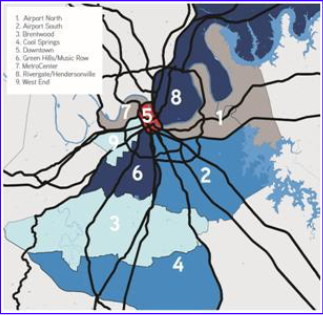 North Sub-Market
Madison is part of the larger Rivergate-Hendersonville office market (Sub-market 8) that extends north from east Nashville to include Sumner County. Based on data supplied by Colliers, this sub-market had a total of about 1.8 million square feet, accounting for just 3.6% of the Nashville office market in 2017. Vacancy has been relatively low in this sub-market, but absorption (change in occupancy) has also been low compared with the Nashville market overall. Basically, the north sub-market has not seen the level of new office construction and market activity that has been seen Downtown, Midtown, or in Williamson County in recent years.
Madison
The inventory conducted for this Strategic Plan identified a total of about 834,000 square feet of office space in the Gallatin Pike/Rivergate Corridor plus another 661,000 square feet in the Due West Avenue office node (including the 560,000 square-foot former Memorial Hospital), for a total of nearly 1.5 million square feet of office space.
Office Buildings. By far the largest building (or campus) being marketed for office use in Madison is Due West Towers, the former site of Memorial Hospital. This 1⁄2-million square-foot site is being marketed for practically any office use. At present, a part of the space has recently come under lease for Metro offices. There are also several temporary leases, but leasing remains active.
The largest purpose-built office building in Madison is the 27,100 square- foot Briarville Business Center (BBC), anchored by St. Thomas Health and its Premier Radiology division. BBC and the 25,100 square-foot Due West Building (which houses Due West Family Health Care, Jackson Dental and other medical tenants), comprise part of the Due West office node that originated as a spin-off from Memorial Hospital.
Other large office buildings in Madison are also dominated by medical uses. The 24,500 square-foot Benfield Pet Hospital, located at 2101 Gallatin Pike, is among the largest buildings currently in use for medical purposes but as an animal hospital and not office space, per se. The buildings at 1717 Gallatin Pike and 620 Gallatin Pike are also medical-oriented, housing Concentra Urgent Care and Centerstone Medical Clinic respectively. The Madison Office Building is not a medical clinic, but houses an administrative support company (Bluegrass Medical Billing) that services medical clients. Other tenants at the Madison Office Building are Hall & Stiler (attorneys) and NOVO Healthcare (psychiatric clinic). Agape Healthcare and CSL Plasma Center are both located in commercial office units at Madison Square.
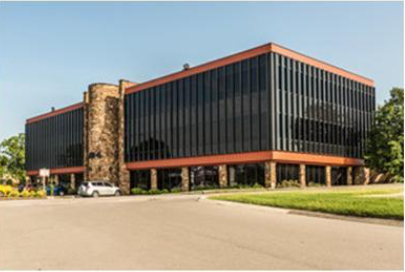
Rivergate Park Office Building
Rivergate Park Office Building
Rivergate Park Office Building, with 24,500 square feet, is located adjacent to RiverGate Mall. This building is partly owner-occupied (real estate broker HQ) with several other tenants including attorney Cobb & Waites and audiologists at Nashville Hearing Clinic. One of the few large vacant and available office buildings in Madison is 113 Cumberland Avenue, with nearly 16,700 square feet of vacant space in a purpose-built office building one block off of Gallatin Pike. A sample listing of large Madison office buildings is found in the Appendix of this report.
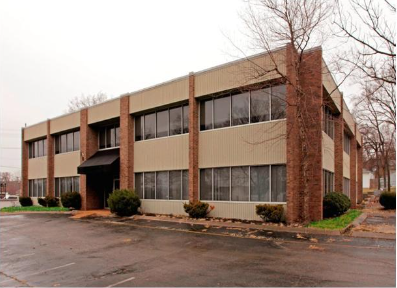
113 Cumberland Avenue Office Building (Photos courtesy LoopNet.com).
Tenant Mix. As noted above, Madison’s office tenant mix is heavily weighted to medical clinics and health care uses, comprising nearly 60% of all office use. Financial services comprise another 19% of all office use, including banks and credit unions. For the purposes of this analysis, payday loan businesses are included in the mix of office uses, although many of these services operate (like insurance brokers, real estate offices and others) out of retail strip centers or consumer-oriented commercial space.
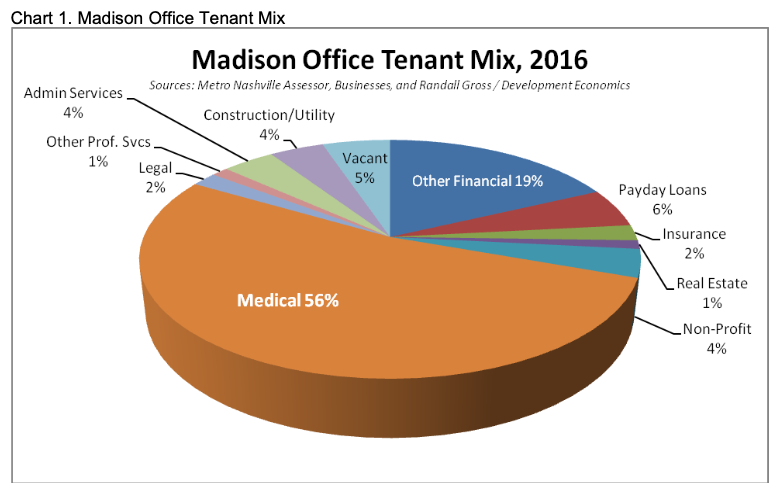
Payday loan offices account for about 6% of the office tenancy in Madison and are therefore the 3rd largest office use in the area. Remaining office uses include a small number of construction & contractor offices, utilities, administrative services firms, insurance and real estate brokers, legal services, non-profit organizations, and other professional services. About 5% of the office space (or space being marketed for office use) is vacant, but many of these spaces are functionally obsolete or no longer marketable for modern office use, suggesting that there is little supply of available and marketable office space in the corridor.
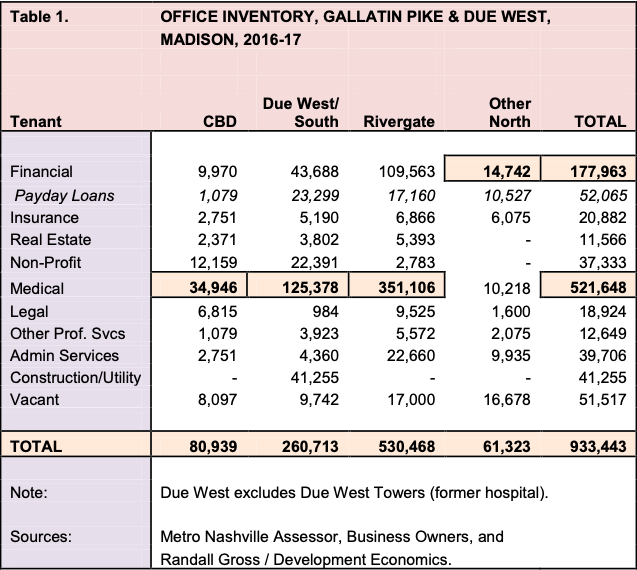
Downtown Madison. Downtown Madison has a total of about 81,000 square feet of office space, with a vacancy rate of 10.0%. Like most of Madison, downtown is oriented to medical uses, which comprise about 43% of office use in the downtown area. Non-profit organizations have also found a home in downtown Madison, occupying about 15% of the office space. While there are a couple of banks, financial services have not congregated in the downtown core as they do in many central business districts. Asking rents for Class B space are around $13.50 per square foot, full service gross.
Due West Avenue. The Due West Office Node has about 661,000 square feet of building space, including the 560,000 square-foot Due West Towers campus of former Memorial Hospital. Due West Towers is largely vacant, although portions are being leased to Metro agencies, religious institutions and small uses. The remaining 100,000+ square feet of office space in this node is primarily occupied by medical clinics and health care providers who originally clustered there for proximity to Memorial Hospital. There is also some ancillary retail/commercial use, as well as the massive Goodpasture Christian School, located in this node. Excluding Due West Towers, the Due West office node represents about 40% of the office space in south Madison (south of downtown). Altogether, medical uses represent nearly 50% of all office use in south Madison. Asking rents for several of the medical spaces in this area are running $14.00 per square foot, full service. While not located in the Due West node specifically, Diamond Gusset Jeans is building a 12,000 square-foot headquarters office and retail store less than one mile south of Due West near Briarville and Cheron Roads.
Rivergate. The Rivergate retail/office node has about 531,000 square feet of office space, making it the largest office node in Madison (if the Memorial Hospital site is excluded). As with the other areas, Rivergate is also dominated by medical tenancy, which represents more than two-thirds of all office use in that node. Financial services are also an important office tenant in Rivergate, representing about 20% of all office use. There is about 22,700 square feet of administrative service use in the node, but this only represents about 4.2% of the total. Asking rents in the Rivergate area are slightly higher than in other parts of Madison (at $15.00-$16.50 per square foot) due to their exposure and traffic associated with the mall and interstate access.
Other North Gallatin. There is office space scattered along North Gallatin Pike between Downtown Madison and Rivergate. This area has less definition as an office or commercial node (once marketed as the “Miracle Mile” by automobile dealers) which may impact on marketing. The area has about 61,000 square feet of office space including the 16,700 square foot vacant building at 113 Cumberland Avenue which establishes a vacancy rate of 27.4% for this area. While there is more than 10,000 square feet of medical use even in this area, there is slightly more office us in banks and financial services. Asking rent for the vacant building has been $14.50 per square foot, full service gross.
Market-Area Office Demand
Office demand was forecasted for Madison based on a number of factors including projected employment growth in office-based industries, office real estate absorption trends, the competitive market framework, and other factors. The Madison Office Market Area is defined below, followed by demand forecasts for the market area.
Market Area Definition
Madison is part of the Greater Nashville Office Market, and is therefore impacted by economic and demographic conditions associated with the Nashville region as a whole. That being said, economic and real estate factors in Davidson County are most pertinent, since Madison is most likely to generate most of its demand from businesses locating or relocating within Davidson County.
Davidson County Employment Forecasts
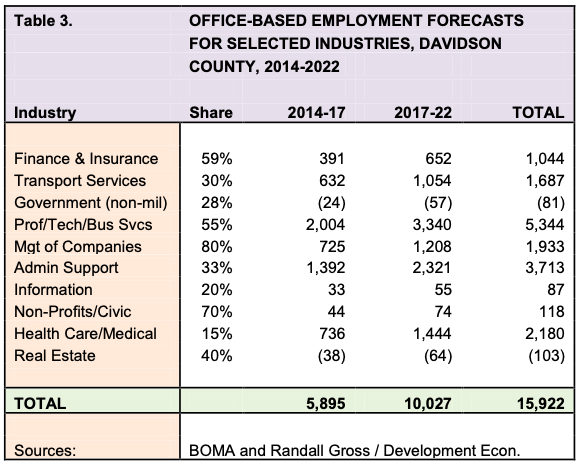
Davidson County is forecasted to add about 30,000 jobs over the next five years, or 5,000-6,000 jobs per year (not including employment generated in suburban counties). The largest number of jobs created will be in health care, which will generate nearly 10,000 jobs alone. Another 7,000 jobs will be created in administrative support (e.g., back office jobs in payroll, processing, customer support, technical support, etc) and 6,100 jobs will be created in professional and technical services. The real estate and government sectors are expected to lose a small number of jobs as the economy begins to cycle down from its ten-year growth trajectory.

Office-Based Employment. Davidson County is expected to gain a minimum of net new 10,000 office jobs over the next five years (aside from the office employment generated in surrounding counties in the metropolitan area). This job growth will generate demand for additional office space to house workers. The number includes about 3,300 office jobs in professional and technical services, 2,300 in administrative support, 1,400 in health care, 1,200 in management services, and 1,100 in transportation services. While some office jobs will also be created in other sectors, the city is expected to lose some office employment in the government and real estate sectors. Given the cyclical nature of real estate, it is likely that the real estate sector will begin to see a downturn within the five-year period.
Job-Generated Demand
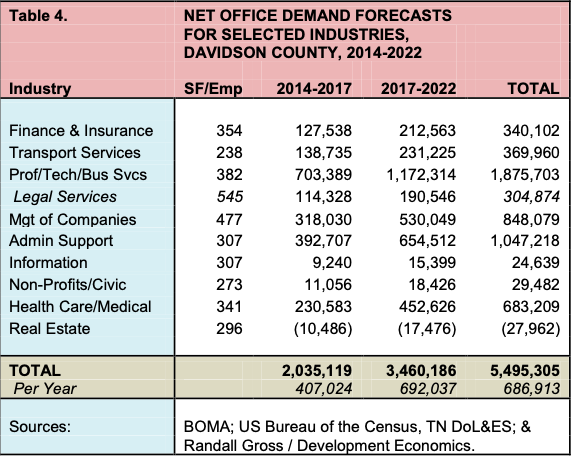
Growth in office employment will generate demand for about 3.5 million square feet of office space in Davidson County (700,000 square feet per year) over the next five years.
Demand for office space to house professional, technical, and business service workers will be greatest, at nearly 1.2 million square feet. There will also be demand for about 650,000 square feet of administrative support service space, 530,000 square feet for management service companies, and 450,000 square feet of medical and health care-related office space.
Madison. Madison’s role in the local economy and its likely share of employment growth was established. Based on this analysis, it was forecasted that Madison would generate demand for about 40,000 to 50,000 square feet of office space over the next five years or by 2022 (8,800 to 10,000 square feet per year).
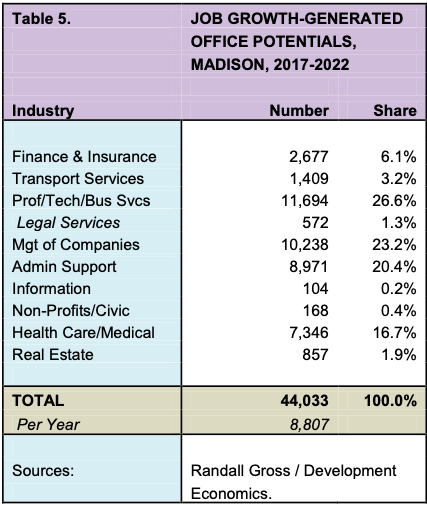 The largest share of this demand would be generated for professional, technical and business services space (27%), followed by management services (23%), administrative support (20%), and health care/medical (17%). Thus, while medical services and health care has dominated Madison’s office market, there is demand that could be captured for other types of office users including business services and administrative support among others.
Nashville Area Office Absorption Trends
The Nashville Area Office Market has generated about 800,000 to 900,000 square feet of office absorption (change in occupancy) per year over the past ten years. The trend has accelerated, with the market generating about 600,000 square feet of absorption per year between 2008 and 2013, and 1,100,000 square feet per year between 2014 and 2017.
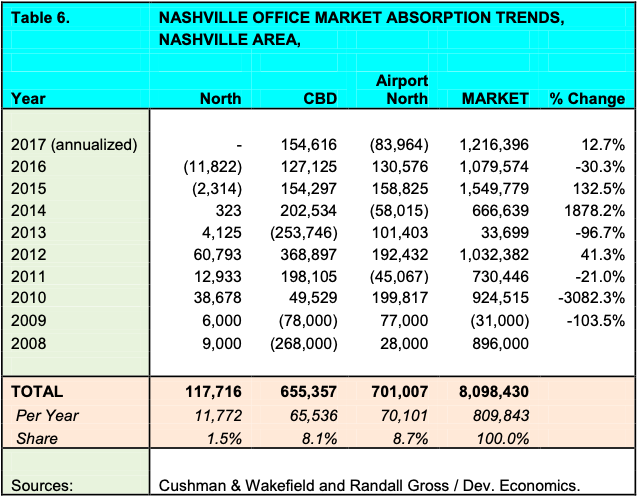
Selected Sub-markets. Several sub-markets were examined that are relevant to Madison. The downtown (CBD) sub-market has averaged about 66,000 square feet of absorption per year since 2008, although absorption has been fairly stable at about 130,000 to 200,000 square feet since 2014. Overall, downtown has absorbed roughly 660,000 square feet of office space since 2008. As prices escalate for office space in the downtown area, smaller office tenants are pushed out to more peripheral neighborhoods like Madison and nodes like Rivergate, Downtown Madison or Due West Avenue in search of more affordable office space.
Surprisingly, the Airport North sub-market has absorbed a similar amount of office space since 2008, although it has represented a smaller portion of the market since 2014. Airport North is located just across the Cumberland River from Madison and includes the Nashville International Airport area, Donelson, Briley Parkway, and I-40 East. The North sub-market includes Madison. This area has absorbed a total of just 120,000 square feet of office use since 2008 or 1.5% of total market absorption (even though it represents about 3.4% of all space).
The North sub-market saw declining absorption since 2014, in contrast to downtown Nashville and other sub-markets where demand has been accelerating. Part of the issue may be the dearth of new and available Class A/B office space in the North sub-market, which really hasn’t seen a significant amount of new office construction in some time. As existing space becomes less competitive and no new space is added, then it is not surprising that absorption has declined. Madison accounts for just 0.34% of the overall office market and a minute share of absorption.
Moving Averages. Trends in sub-market share of absorption are indicated below by time period. As indicated below, the North Sub-market’s share of overall market demand (as measured by absorption) has fallen from 4.6% in the 2009-2013 period to less than 0 by 2013-2017. Meanwhile, downtown has generally maintained a market share of at least 10-12% until the latest period, when there was a slight drop. The market share for Airport North is also eroding, having fallen from nearly 20% in 2009-2013 to just about 6% in the latest period.

While downtown remains strong, declining market share in the North and Airport North sub-markets indicates that the north/east portions of Davidson County are becoming less competitive for office space in comparison to Midtown, Downtown, and suburban jurisdictions like Brentwood and Cool Springs. Again, this declining competitiveness may relate not to some inherent flaw but rather to the lack of investment in the area’s existing office stock and promotion of new office nodes.
Absorption Forecasts
Based on the moving averages and absorption models, overall market absorption was forecasted at an average of 750,000 to 850,000 square feet per year over the next five years. Absorption in the North Sub-market (with some marketing interventions) is forecasted at 10 to 15,000 square feet per year or a total of about 50,000 to 90,000 square feet by 2022. Madison could be expected to capture demand for about 2,200 to 4,000 square feet per year.
Madison Office Market Potentials
Based on these analyses, it was determined that Madison has potential for development of 20,000 to 48,000 square feet of office space by 2022. This number is based, in part on employment-induced demand for about 8,800 to 10,000 square feet per year and absorption-generated demand for 2,400 to 4,000 square feet per year. This total is equivalent to the development of one or two additional buildings similar in size to the largest existing office buildings in Madison, or to the occupancy of its largest vacant building (113 Cumberland Ave.), or to recruitment of smaller businesses to new office space in the area.
This forecast is predicated on the assumption that there would be a pro- active marketing and business recruitment effort for Madison as outlined in Part C of this Strategic Plan. These potentials do not include the opportunity for “drop- in” uses such as a corporate office or customer support center that might be recruited to Madison outside of the parameters of the real estate market. Such a single use might be attracted to sites like Due West Towers or other locations.
Key Target Tenants
The market analysis also identified the potential for specific types of tenants that could be targeted for recruitment purposes and to fill vacant space. In general, it was determined that Madison is competitive for attracting businesses serving the Nashville/North market but requiring affordable space in a central location. Ultimately, Madison is becoming more attractive with each day that office rents escalate in Downtown, Midtown and other sub- markets. If elements of the proposed transit plan move forward, then Madison’s competitiveness will increase further with transit to leverage the office market for commuters. Among the specific types of target tenants are the following:
- Administrative Support Services
- “Back Office” business support activities
- Processing
- Customer services and technical support
- Professional & Technical Services
- Accounting, tax, bookkeeping, payroll services
- Computer systems, IT design & related services
- Consumer credit counseling & repair
- Management, scientific & technical consulting services
- Product testing & development services
- Specialized design services
- Engineering services
- Non-Profit, Arts & Cultural Organizations
In addition, Madison will remain as an attractive location for medical services and health care, banks and insurance brokers, construction contractors, management services (corporate or regional offices), and others.
Competitive Locations
While its space is somewhat disjointed, the Due West Towers (former Memorial Hospital) site would be attractive for large users such as administrative support operations (e.g., medical bill processing) in need of large floor-plate facilities or sites with good accessibility and a central location. Broadband width, carrying capacity and speed will also be important factors in attracting many of these businesses. Downtown Madison and surrounding areas can be attractive for small IT firms, arts & culture, non-profits, design & testing services, music industry-related offices & studios, finance & insurance, and other office uses. Rivergate is attractive for finance & insurance, processing, management services/regional offices, consumer credit, consulting and other office uses. There may also be opportunities for new corporate office development near the interchanges formed by Briley Parkway and I-65 and/or Ellington Parkway/Briarville Road/Creative Way (formerly Cheron Road).
Section 2. INDUSTRIAL MARKET ANALYSIS
An industrial market analysis was conducted for Madison, with a particular focus on the Myatt Drive Corridor and the opportunities for flexible multi-tenant industrial space. The market analysis examined existing conditions and forecasted demand within the competitive market for manufacturing, warehouse/distribution, flex, and office/warehouse space.
Existing Market Conditions
The Nashville market has nearly 208,000,000 square feet of competitive industrial space, according to data supplied by Cushman & Wakefield. The market is growing rapidly, with nearly 4.0 million square feet under construction at the end of 2017 and absorption of more than 3.0 million last year. About 70% of Nashville’s industrial space is in warehouse and distribution, with 25% in manufacturing and 5% in flex buildings. Occupancy is high, at 96.6%, and even higher for manufacturing space (97.7%), which tends to include more single- occupancy tenants. Plus, much of the region’s manufacturing space is owner- occupied rather than leased. But occupancy is also high for multi-tenant flex space (97.5%). Industrial rents (averaging $5.09 per square foot) are increasing by about 3-4% per year, significantly slower than in the office market. Rents are highest for flex space ($9.57) versus manufacturing ($4.09) and warehouse ($5.01).
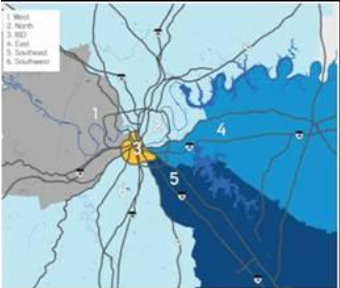
Industrial Sub-Market Map showing the North Sub- Market (#2, light blue)
North Sub-Market
Nashville’s industrial market tends to be concentrated in the Southeast Corridor (I-24), which contains nearly one-third of all industrial space. The North Sub-Market, which includes all areas of Davidson County and portions of Sumner and Robertson counties north of the Cumberland River, had a total inventory of about 38.1 million square feet in 2017, accounting for about 18% of the total Nashville Area market.
Although it is generally healthy, the
North Sub-Market has not performed as
well as other industrial markets in Nashville. For example, the North has a vacancy rate of 5.6%, compared with a market-wide vacancy of 3.4%. North Sub- Market absorption was -514,000 square feet in 2017, versus +3.1 million square feet market wide. North rents averaged $3.42 per square foot, or just 67% of the market average.
A massive new industrial space was added to the North Sub-Market in 2017, the 600,000 square-foot Skyline Distribution Park, located on a prominent hill along I-65 at the split with I-24, with a view of Downtown Nashville. This new development is located less than one mile south of Briley Parkway and Madison, and therefore adds exposure and value to Madison’s competitive positioning as an industrial location.
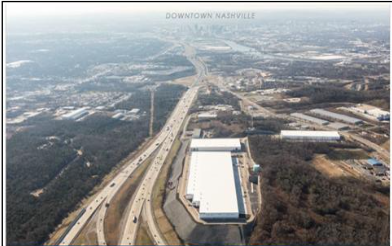
The new 44-acre, 600,000 square-foot Panattoni development, Skyline Distribution Park, located on I-65 and Brick Church Pike near I-24
This project is about 16% leased to-date, and there is activity on much of the remaining space. Existing tenants include a Virginia-based building supplier and media giant Gannett. Asking rents for the smaller spaces are $5.65 to $6.00 per square foot, which is significantly higher than other industrial spaces in the North Sub-Market but roughly on par with other large, new distribution facilities around Nashville.
Madison
As noted earlier, most of Madison’s existing industrial space is concentrated in the Myatt Drive Corridor, between Gallatin Pike and Anderson Lane. The Myatt Drive Corridor has a total 2.44 million square feet of industrial space (out of a total 2.9 million square feet of all uses). In addition to Myatt Drive, Madison also has older industrial uses scattered along the north-south rail line west of Gallatin Pike (along Nesbitt Lane, Douglas Street, Williams Avenue, Woodruff Street, Gallatin Pike, and other streets), comprising a total of about 400,000 square feet of industrial space. Altogether, Madison has about 3.0 million square feet of industrial space in its two main industrial corridors, representing about 8% of the North Industrial Market. Many of Madison’s industrial companies occupy their own purpose-built buildings while others lease in multi-tenant spaces.
Myatt Drive Corridor
As noted above, Myatt Drive is the primary industrial location in Madison. The Corridor has a total of about 2.9 million square feet of space, of which 2.44 million is in industrial uses. Remaining space is in lodging, retail, services, institutional, office, and recreation use. Warehouse/distribution uses account for about 37% of the corridor’s industrial use, or about 900,000 square feet. Of this, 9% is in wholesale trade or equipment rental businesses.
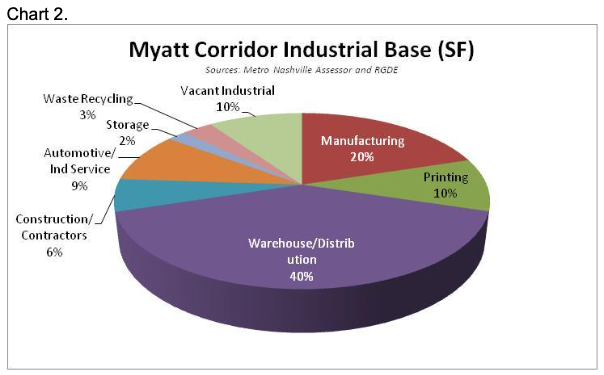
Another 18% is in manufacturing use, accounting for approximately 450,000 square feet. Printing, which accounts for about 9% of industrial use, is a form of manufacturing. If included, manufacturing comprises closer to 27% of all industrial use. Other industrial uses in the Myatt Drive Corridor include automotive and industrial service (8%), construction/contracting (5%), waste recycling (3%), and storage (2%). About 8.8% of Myatt Drive’s industrial space was vacant in 2017.

The following describes some of the buildings and parks with multiple building spaces for ownership or lease, along with some of the existing businesses. It should be noted that many of these uses and parks are located on small side streets that branch out from Myatt Drive itself.
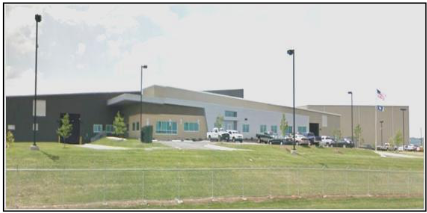 Rivergate Industrial Park.
Located off of Myatt Drive, Rivergate Industrial Park has a total of about 200,000 square feet of existing industrial space, plus land for further development. The site also backs up to the former Miller Motte Technical College property, which is proposed for mixed-use development, and offers rail spur access. The 154,000 square-foot Blue Lane Distribution facility is the largest building in this park and houses Marangoni Tread, a tire retreading plant. Dunkin Donuts has recently built a 31,000 square-foot distribution facility in this park.
Northgate Business Park. This park has a total of approximately 330,000 square feet of space, located just off of Myatt Drive. Key uses include Novo Health Systems (43,000 square feet) and two multi-tenant warehouse buildings (1236 and 1239), each with about 19,000 square feet of space. A 15,000 square- foot warehouse building (#1220) was vacant in 2017. Businesses in this area include roofing companies, industrial suppliers, laundry, and storefront church, among others.
530-538 Myatt Drive. Multi-tenant buildings located at 530-538 Myatt Drive have a total of about 750,000 square feet of industrial space. About 105,000 square feet in #530 was for lease in 2017. Key tenants include Dunlap & Kyle Tire Company, Geodis Logistics, Triangle Tire (a logistics company serving a Chinese tire manufacturer), Prestige Printing, Precision Fabrics, Environmental Water Systems, and others.
Fant Industrial Drive. This strip has a total of about 328,000 square feet of industrial and other uses including Monterrey Coffee Packers, Binswinger Glass Company (auto glass), Tri-Imaging Solutions, Tennessee Sheet Metal, and others. About 23,000 square feet was vacant in one 115,000 square-foot warehouse. Another 8 acres of land was available and for sale in 2017.
Myatt Boulevard. The Myatt Boulevard area has about 93,000 square feet of space, with uses including Mid-Tech Garage (auto repair), Cambridge Machinery, Arcus Restoration, Wireless Plus, and American Appliance Products, among others.
Myatt Industrial Drive. Not to be confused with Myatt Drive, Myatt Industrial Drive is a side street with about 60,000 square feet of industrial space. Uses include Grand Fire Protection (in office/warehouse space), a car wash & detailing center, Collins Machine & Tool, Orkin, Digital Group Cabling Solutions, Ace Industries (cranes & industrial equipment), and others.
Madison Industrial Drive. Not to be confused with Myatt Industrial Drive, this road has about 205,000 square feet of industrial and office/warehouse space. A 40,000 square foot warehouse was available for lease and 6.4 acres were available for sale in 2017. Key uses include the 28,000 square-foot Hercules Bolt Company, 26,000 square-foot S&H Chrome Plating & Powder, Grand Central Party Rental, ServPro, Pioneer Coach, Deka Batteries, East Penn Manufacturing Company, and others. Myatt Center Lane has 12,000 square feet of office/warehouse space.
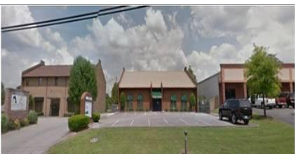 Other. The remainder of Myatt Drive outside of these relatively self-contained parks and side streets offers a “hodge-podge” of diverse uses. There are several 30,000+ square-foot multi-tenant buildings along Myatt Drive that are occupied primarily by service industrial, auto-related, retail, and institutional uses. Stephens Pipe & Steel has a 12,000 square-foot facility in the corridor. Five Hundred Edenwold is a 500,000 square-foot warehouse.
Waste Management Rivergate operates a 70,000 square-foot recycling facility on Myatt Drive. Buy Floors Direct has a 32,000 square-foot wholesale outlet. Edenwald Missionary Baptist Church, Rogers Group (construction material storage), Metro Nashville Wastewater Treatment Facility, Metro Police, MTA, a junkyard, Burnt Smoke Shop (convenience tobacco), America’s Motor Sports (retail), Ezone Auto Painting, Bath Fitter, In-Town Suites Motel, Lovebound, and Public Storage are among the other uses in the corridor. This collection of diverse and somewhat random uses does not help strengthen the marketing image of Myatt Drive as an industrial corridor, despite what may exist on side streets.
Railroad Industrial Corridor
As noted above, Madison also has some industries scattered along streets intersecting with the north-south rail corridor, west of Gallatin Pike. These streets collectively contain a total of about 400,000 square feet of industrial, service, and wholesale/supply use. Among the industrial uses in this area are Triangle Fastener Corporation (18,180 square feet), U.S. Lumber (135,300), Building Supply Source (66,700), Public Storage (54,900), Accurate Autobody (17,300), D-Squared (5,000), U-Haul (59,000), and a number of smaller uses ranging from sign shops and carpenters to auto repair garages. The several large self-storage facilities face onto Gallatin Pike but extend west to the railroad. Many of these uses constitute a lower class of older industrial space that is not marketed for prime manufacturing or distribution uses but may be marketable as affordable space for a variety of small business uses. However, only a handful of these spaces are vacant or available.
Market Area Industrial Demand
Demand for industrial space was forecasted for the market area through 2022, based on employment projections for key industries, economic projections, industrial real estate absorption trends, tenant movements, and other factors. The market area is defined below, followed by a discussion of industrial demand.
Market Area Definition
The Madison industrial market area was generally defined as the area north of the Cumberland River in Davidson County (e.g., Madison, Inglewood, East Nashville, Dickerson Pike) plus the Downtown and Midtown areas of Nashville. Madison would generate a majority of its industrial demand from within this Market Area.
Market Area Employment Forecasts
Employment within key industrial sectors was forecasted for the Market Area. This area has an estimated 18,340 industrial jobs and is expected to add another 510+ industrial jobs over the next five years, for a total of 18,850. This number represents a 2.8% increase over the five-year period.
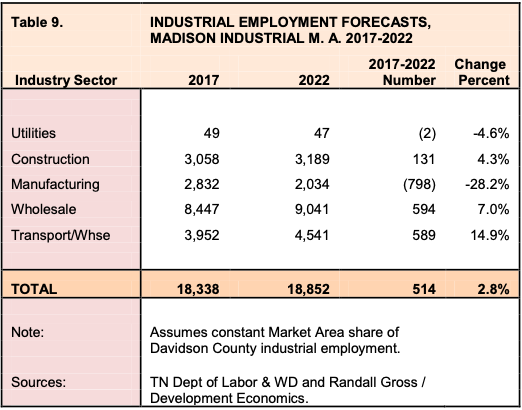
There will be a relatively similar gain in wholesale trade and transportation & warehousing employment, with the Market Area adding close to 600 workers in each sector. Construction will add another 130 workers and utilities will remain constant. However, there is expected to be continued decline in manufacturing, with the Market Area losing another 800 jobs or 28% by 2022. Nevertheless, the expected gain in industrial employment represents a positive sign.
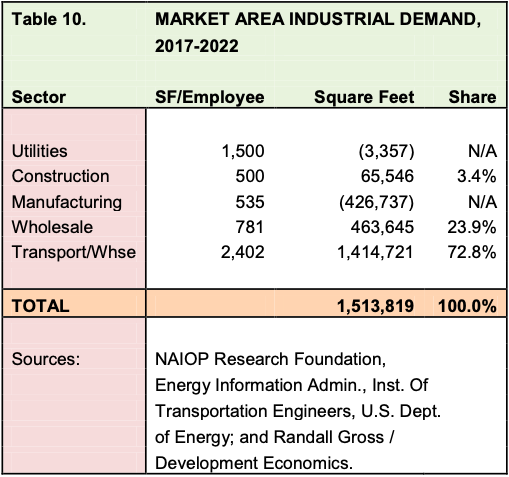
Based on an employment-driver analysis, there would be demand for about 1.5 million square feet of industrial space within the Market Area over the next five years. There will be a continued shift in demand from manufacturing to more distribution and warehousing, with the latter accounting for nearly three- quarters of all industrial demand in the Market Area over the next five years. Wholesale trade, including various industrial suppliers, will account for about 24% of demand while construction-related businesses and contractors will generate a small amount of demand as well.
Absorption Trends
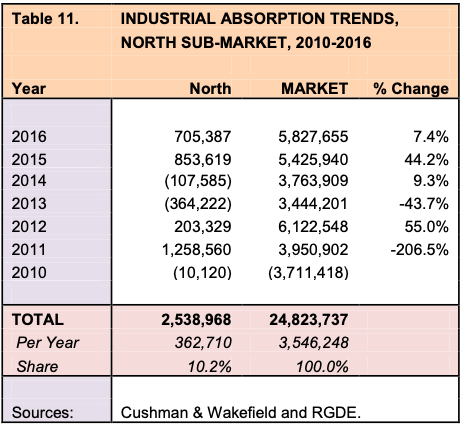
Industrial absorption within the North Sub-Market has fluctuated wildly in recent years, especially in comparison with the regional average overall. While the Nashville area has had fairly consistent annual absorption of about four to six million square feet (3.5 million per year since 2010), the North Sub-Market has seen absorption fluctuate between -364,000 to 1.3 million square feet per year. On average since 2010, the area has had absorption of about 360,000 square feet per year, representing about 10.2% of the overall market.
Myatt Drive. Absorption was calculated for the Myatt Drive Corridor based on construction trends and known occupancies. Based on this information, the Myatt Drive Corridor has accounted for about 2.0% of North Sub-Market absorption since about 2010.
Myatt Corridor Industrial Absorption
- 1969-2001: 61,200 square feet/year
- 2002-2006: 22,900 square feet/year
- 2007-2017: 7,100 square feet/year
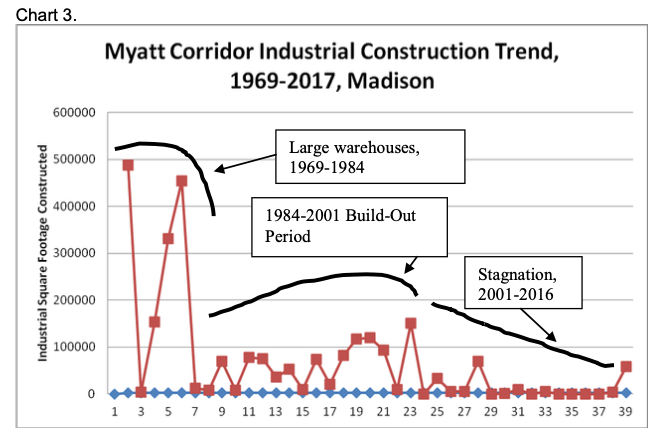
The corridor’s absorption has fallen over time, as the area has become built out. During its initial build-out period from 1969 to 2001, the corridor saw average absorption of 61,200 square feet per year. Between 2002 and 2006, absorption fell to 22,900 square feet per year. And during the latest period from 2007 through 2017, the corridor only averaged 7,100 square feet per year. There has also been increasing “infiltration” of non-industrial uses like those listed previously (retail, motel, auto service, institutional, waste, etc).
Despite the long-term decrease in industrial absorption, the Myatt Drive Corridor has begun to see increased activity during the past one to two years. As shown on the following chart, mapping industrial construction activity since 1969, there is a sudden “bump” in activity after a long drought.
Section 3. HOUSING MARKET ANALYSIS
This section provides findings from a Housing Market Analysis for Madison that examined the potential for both market-rate and affordable workforce housing. With more than 40,000 residents and nearly 20,000 housing units, Madison is a diverse and complex housing market within the broader Nashville Metropolitan Area market. Its diversity of relatively affordable housing opportunities is a major part of its appeal to prospective homeowners and renters, especially as other parts of central Nashville have experienced rapid price escalations. But that very affordability is now under threat as rents and home prices increase in parts of Madison. The following market analysis examines the broad market potentials but also focuses on considerations relating to the preservation or enhancement of affordable workforce housing in Madison.
Existing Housing Market Conditions
Madison had approximately 19,440 housing units, according to the 2016 American Community Survey, conducted by the U.S. Bureau of the Census. In general, the oldest housing is located in early 20th century neighborhoods like Montague, Edenwold, and Madison Park. Housing built in the 1940s and 1950s accounts for roughly one-third of all housing in Madison, an indication of the post- war suburban housing boom that Madison experienced.
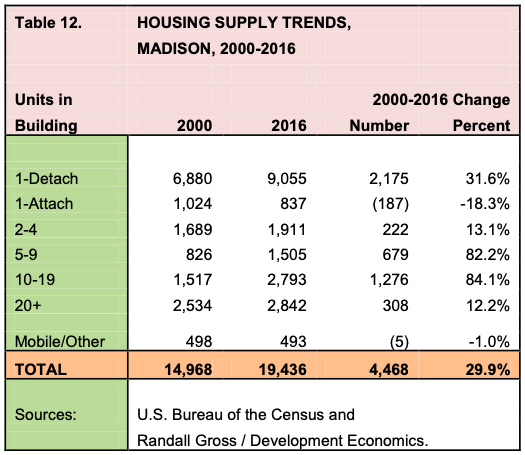
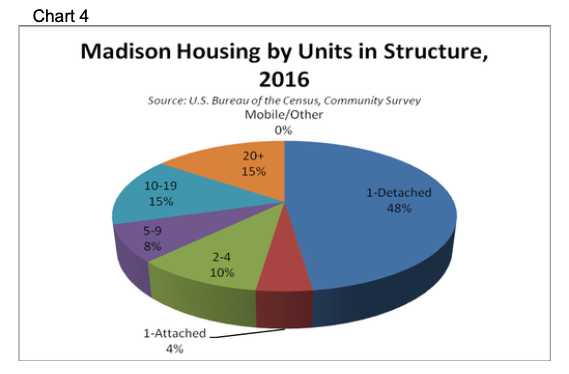
Nearly 50% of Madison’s housing stock is in single-family detached units (e.g., cottages, ranches, bungalows, etc) and 40% is in multi-family buildings (with more than five units). The remaining 10% are in duplexes, triplexes, and other small multi-family structures. The number of units increased by nearly 4,500 or 30% between 2000 and 2016; and this is a sign that Madison has continued to grow well after the post-war boom years. The fastest growth has been in multi-family buildings but the largest number of units (nearly 2,200) has been added in detached single-family housing. Madison has seen a declining number of attached single-family homes as well as mobile homes. Madison does not have a substantial number of housing units in RVs, boats, or other non- traditional types of permanent shelter.
Among the relatively new uses that have entered, or are entering, the Myatt Drive market are Marongoni Tread (50,000 square feet, 2011), Absolute Auto Repair (11,840sf, 2017), Dunkin Donuts Distribution (31,050sf, 2017), Warehouse (15,625sf, 2018), Orkin, Forrest Landscape, and most recently the 6- acre campus of Yazoo Brewery. Yazoo will be building its own facilities at the site, relocating and expanding production from its original facilities in The Gulch. Within the Railway Corridor, Building Supply Source located in a 66,700 square- foot facility in 2017.
Madison Industrial Potentials
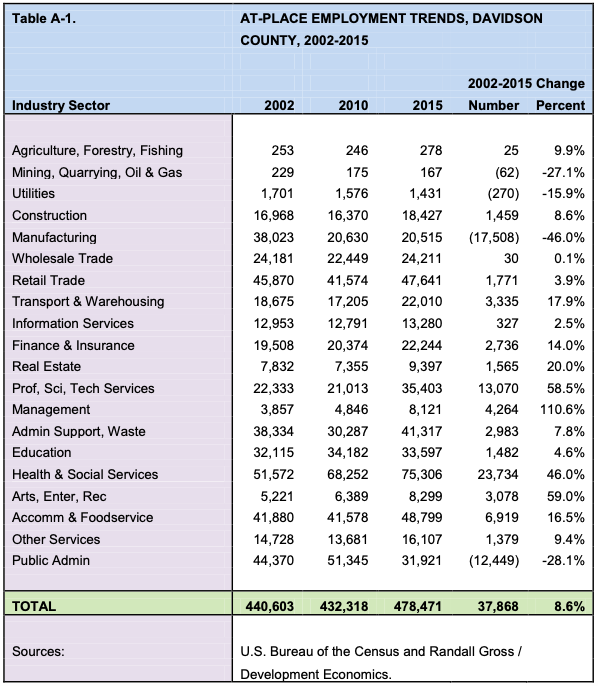
Madison lost over 1,000 manufacturing jobs between 2002 and 2015, although more than one-quarter of those jobs were in one facility, the Odom’s Sausage plant on Neely’s Bend Drive. Employment in utilities, wholesale trade, and warehouse/distribution actually increased in Madison between 2010 and 2015. There is an apparent shift underway in terms of Madison’s competitive positioning within the broader market base.
While Madison remains a part of the less-active North Sub-Market, there is also broader movement originating in rapidly-gentrifying areas like SoBro, South Nashville (Wedgewood-Houston), The Nations, Germantown and others that have housed industrial companies now looking to expand or for affordable space elsewhere. A perfect example is the recent relocation of Yazoo Brewery from The Gulch to Myatt Drive. There are also companies relocating to Nashville that prefer a location within relatively close proximity to Downtown but that also need affordable space. Thus, the market base for Madison industrial areas is expanding.
There is a declining number of competitive industrial locations within Davidson County, largely due to displacement and gentrification of older industrial areas close to downtown. Certainly industrial sites and buildings within the Southeast Corridor along I-24, Nolensville Pike and Murfreesboro Pike remain highly competitive with a Madison location. But even there, the recent announcement of soccer stadium development at the Fairgrounds could help drive a shift in development patterns and prices in the 4th Avenue / Nolensville Pike Corridor. A similar shift is underway along Dickerson Pike, which is seeing increased residential development activity.
Based on recent trends and market-area projections, Madison’s “fair share” of employment-driven demand in the Market Area would be 138,500 to 235,000 square feet (or an average of 186,750 square feet), based on growth in the employment base. Absorption models suggest that Madison has potential for 156,000 square feet of absorption by 2022. However, Madison can also pro- actively recruit new businesses and package sites and buildings for “drop in” industrial development above and beyond market capture. These forecasts are predicated on a pro-active marketing and business recruitment effort focused on Madison and oriented to packaging of specific sites and buildings.
Key Industrial Recruitment Opportunities
Madison’s target industrial recruitment opportunities were determined based on the findings of the market analysis. These growth opportunities relate in large measure to attracting companies that serve the local and regional market, and therefore need an affordable central location in Davidson County. Interstate accessibility is a major determinant for many industrial locations, and Madison does provide opportunities with good interstate access. But Myatt Drive also offers fairly easy highway access, even if it is not direct.
Logistics
Madison offers the opportunity to attract local and regional companies engaged in warehouse, wholesale supply, and distribution activities; or that are otherwise involved in the logistics supply chain. Madison has seen the location of a major warehouse/distribution hub established less than one mile south on I-65. Absorption of space in that facility has been slower than expected, but once it reaches a “tipping point,” there will likely be pressure for more distribution space in the I-65/I-24 Corridors. Myatt Drive began with development of large warehouse and distribution facilities and distribution is still finding its way to that area today. With access to I-65 less than one mile away but with cheaper land and more affordable building space, Myatt Drive offers some competitive advantages for logistics.
Madison and Myatt Drive have long attracted wholesale suppliers for some of the same reasons that distribution services located there: market access and good transportation network. In particular, Madison is competitive for wholesale trade companies within the medical/health care, industrial equipment, and construction industries.
Contractors
Madison is fairly centrally located for construction contractors and others serving a regional client base. Madison is well-suited for attracting construction, structural, & refurbishment, environmental, telecomm, landscaping, and other contractors. There is also the opportunity for recruiting testing & development (T&D) companies that form a part of the technology cluster. Again, these companies are likely to serve a local and regional client base.
Fabricators
Manufacturing has gradually and painfully shifted from labor-intensive production to capital-intensive or tech-driven industry, some of which can now be accomplished (through 3-D printing) directly by the user. Despite those changes for large manufacturers, fabricators and artisanal work still require more traditional production capacity and facilities. Small-scale machining along with metal, iron, and steel fabricators still form a part of the industrial market base. Carpentry and woodworking companies are already clustered in Madison and there are opportunities to build on this industry. Madison also offers excellent opportunities for artisanal craftwork as well as for small tech companies and makers that need shared space or multi-purpose facilities. Information technologies are increasingly integrated with or into production, so the lines between tech companies, small-batch “makers,” and traditional producers are increasingly blurred. Given Madison’s diverse and eclectic collection of relatively affordable sites and spaces, there ample opportunities for Madison to attract and cluster these activities.
About 90% of all units were occupied in 2016, with 2,145 vacant units (down by 7% from 2,296 in 2014). Some of the units counted as vacant had been condemned due to water damage caused by the 2010 Nashville Flood and have since been demolished. The highest overall vacancies are in areas located east of Gallatin Pike. In 2016, 56.6% of occupied housing units were rented while 43.4% were owner-occupied. More detailed analysis is provided below by housing tenure.
Housing Tenure
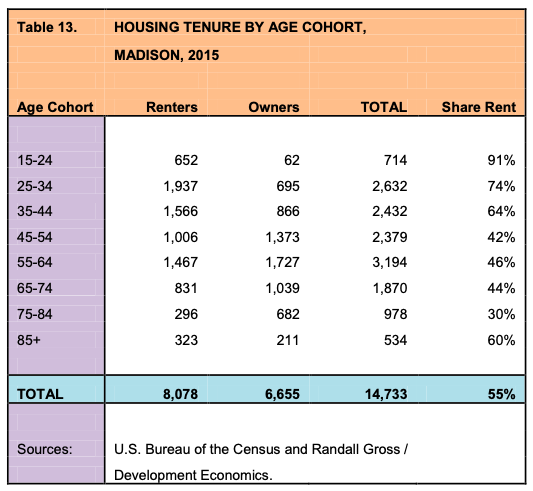
Madison had nearly 15,000 households in 2015. About 55% of households were renters and 45% owners. In general, ownership tenure increases with age among Madison’s households. For example, 91% of the householders aged 15 to 24 are renters, while only 30% of those aged 74 to 84 are renters. Rental tenure tends to fall below 50% among those age 44 and older. The largest number of renters is in the 25 to 34 age cohort, while the largest number of owners is aged 45 to 54. Issues with affordability tend to impact more on younger households, where incomes are lower than among householders who are older and more established.
For-Sale Housing Market Trends
Real estate markets are subject to natural cycles based on supply, demand, and other factors. The Nashville area experienced an uptick in housing prices and sales that peaked around 2007 before the effects of the global financial crisis and a national recession drew the market into a down cycle which reached its nadir around 2010. Since then, the Nashville market saw accelerating housing price and sales growth up to January of 2018, when the market experienced the first year-on-year price decrease eight years.
Home Prices. As a part of the Nashville market, Madison has experienced a similar housing cycle and the ripple effects of Nashville’s growth. Based on MLS data, Madison’s average housing prices increased by about 43% between 2000 and 2007 (or from about $86,000 to $123,000). During the real estate crisis, prices fell back to a low of $65,000 in 2010 before returning to the previous high of $123,000 in March 2015. By July 2017, Madison’s average home prices had climbed by another 26% to $155,000 and continue to increase.
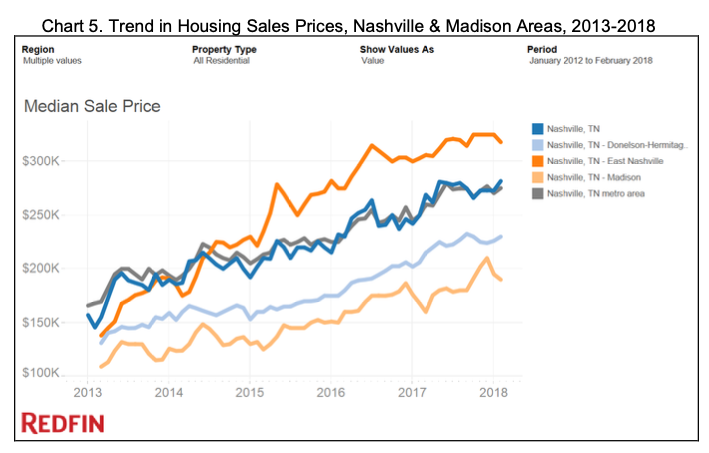
Based on data collected by Redfin, Madison’s median home prices have lagged behind those of the Nashville Metropolitan Area but the gap is closing as Madison’s prices increase at a faster rate than those of the Metro Area as a whole. In 2013, Madison’s prices were about 64% of Metro-Area prices ($109,000 versus $170,000). But by 2018, Madison has median home prices are about 70% of those in the Metro Area as a whole ($190,000 versus $275,000). Over the 5-year period, regional median housing prices increased by 61.8% while Madison’s increased by 74.3%.
Madison’s home prices have tracked closely with those in the neighboring Donelson-Hermitage-Old Hickory market, although Madison has continued to trail that market over the 5-year period. Hermitage, especially, offers newer housing stock while Madison has seen a lower level of new housing construction.
As shown in the chart, East Nashville housing prices have increased rapidly, starting 20% below those of the Metro Area in 2013 but increasing rapidly to nearly 20% higher than Metro Area median prices in just five years. East Nashville’s housing prices increased by 130% over the five-year period, from a median of $138,000 to $318,000. Clearly, such a rapid increase will have an impact on neighboring markets like Madison.
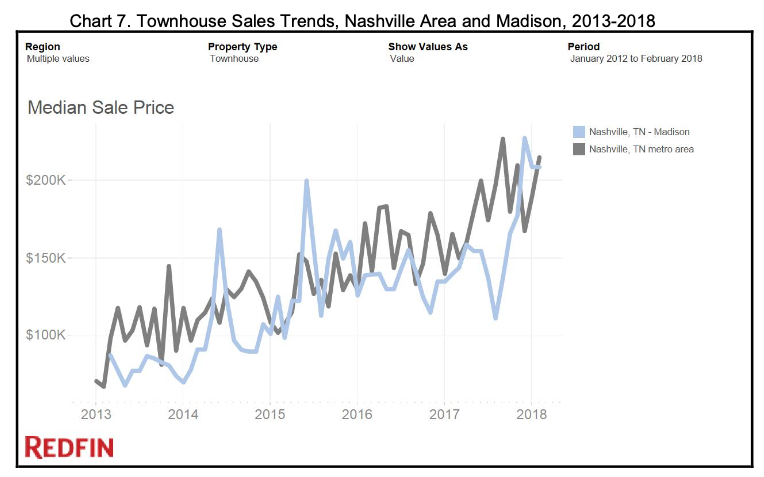
Condominiums. Condominium sale prices have risen at an even faster pace in the Nashville area and within Madison. Median condo prices increased from about $150,000 area-wide in January 2013 to nearly $250,000 by January 2018 representing a 67% increase.
Number of Sales. Interestingly, the number of home sales in Madison has not returned to October 2016 peak levels of more than 250 sales in one month. Rather, sales were hovering around 210 per month in October 2017 and down to 170 by February 2018.
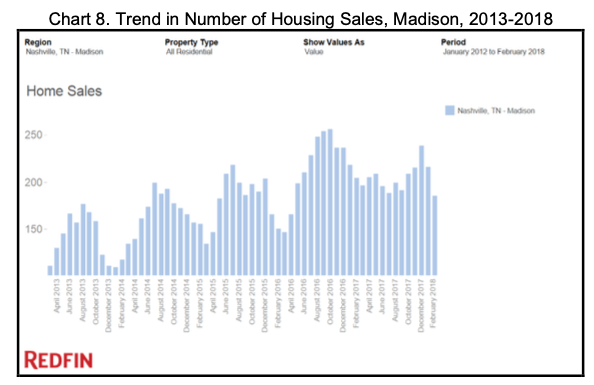
The lower sales volumes relate in some measure to the lack of housing product available for sale in the Madison market, but it may also indicate that the market peaked in 2016 and is flattening out. The number of sales is a leading indicator which is likely to translate into lower prices in the near future.
Days on Market. Another key market indicator is the number of days that houses stay on the market before they sell. As shown below, the amount of time required to sell a house in Madison and throughout the Nashville area has fallen each year since 2013.
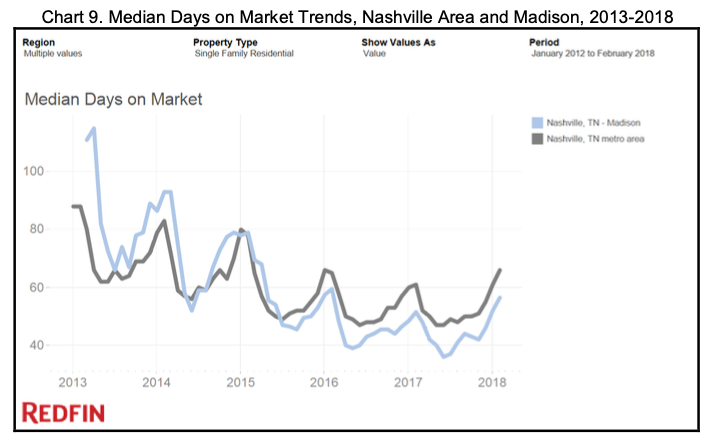
The data seem to suggest that Madison’s positioning within the market has improved, since the time required to sell homes has fallen faster in Madison than in the market as a whole. However, the trend seems to be bottoming out, so the next few months will be critical to see whether the market has peaked with respect to “churn” and the balance of supply and demand.
Housing Product. Madison has significant diversity in its for-sale housing product although, like most of the Nashville-area market, it lacks significant attached housing (e.g., townhouses or row houses). For-sale product in Madison includes ranch-style houses, bungalows, cottages, and other detached units. As noted elsewhere in this report, the west side of Gallatin Pike tends to have more suburban ranch-style housing built on bigger lots (0.25 to 0.5 acres) while the east side tends to have smaller cottages and bungalows on smaller lots, especially around downtown Madison. Homeowner vacancy is highest among smaller homes in this area, averaging 3.1%, versus practically no homeowner vacancy at all in Rivergate, Shepherd Hills, Larking Springs, Montague or the Gateway (Ronnie Road) area.
There is relatively little new product built since 2010. Among the newer developments is a 66-lot development near Myatt Drive along Stoney River Lane, Stable Court, Maylene Drive, and Betty Lou Drive. Homes in this area sell in the low $200,000 range for about 1,800 to 2,500 square feet (3BR/3BA). About 38 of the lots had been built by 2017. Some are investor-owned properties that have been offered in the rental market.
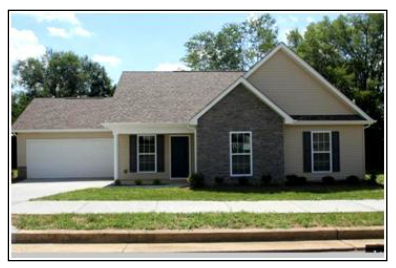
New homes on Stoney River Lane in Madison.
Existing Market Drivers. Brokers have identified four key demographic cohorts driving the current market for the sale of housing in Madison, as follows:
- People relocating to Nashville for work in arts & music, health care, hospitality, and other key modest-wage industries.
- Those working in Madison and Rivergate.
- Millennials who want to live in East Nashville, but cannot afford it.
- Those with small (younger than school-age) children who are moving up and out of rental units in East Nashville and looking for a house with a yard. Once kids reach school age, parents tend to look outside of Davidson County due to perceptions of school quality.
- Those moving out of East Nashville and looking for more home, more space, and more quiet.
- Empty nesters, retirees, divorcees, and others moving “down” for affordability/low-maintenance (although an increasing number are leaving Davidson County due to taxes and other costs).
In the future, key drivers will potentially include access to the proposed Gallatin Pike Light Rail line, which would enhance commuter housing opportunities within walking distance to the station(s). Since many Millennials do not have cars, walkability will be a key factor for attracting them to Madison.
Rental Housing Market Trends
The Nashville Area apartment market has been growing rapidly. Based on a sample inventory of 95,300 units (out of 130,000 total), there were another 13,400 under construction and more than 13,000 more planned and proposed as of 2017. Vacancy inched upwards, with the onslaught of new units, to 7.6%, but the average rent also continued to increase (albeit at a slowing pace) to $1,200 per month. Apartments in the highest price brackets started to see softening conditions as supply exceeded demand at those prices, and managers began to offer concessions for the first time in some years in Nashville.
Affordable (below market) units accounted for about 10% of the total, and vacancy in affordable units was far below the market average, at just over 3.0% (versus 8.1% in market-rate units), an indicator of the under-supply of affordable apartments in the market. The challenges of building more modest-priced units have continued to increase with the cost of construction labor and materials.
Throughout 2017, the Nashville apartment market continued to build in volume and price.
North Sub-Market. Madison is part of the North Apartment Sub-Market, which includes much of Davidson County north of the Cumberland River. Further north, Hendersonville and Gallatin form their own separate sub-market.
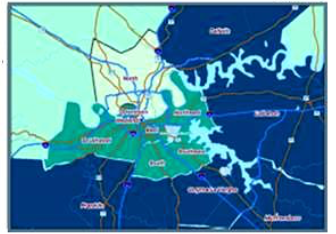 According to Real Data, the North Sub- market has a total of nearly 7,700 apartment units, comprising 8.0% of the total Nashville Area apartment market. As of 2017, about 470 of these units were vacant, yielding a vacancy rate of 6.2%, up from 4.9% one year earlier. As of 2017, The NSM had a total of about 940 units under construction,
Rents averaged $927 in the North Sub-Market (NSM), roughly 81% of the market average. Affordable units account for nearly 30% of the North Sub-Market inventory and the NSM had the lowest average rents of all 13 sub-markets in the Nashville Area. The next lowest rents were found in the East and Lavergne/Smyrna sub-markets, while the highest rents were found in the Downtown and West End sub-markets. NSM average rents per square foot ($0.984) were also low, ranked 12th out of the 13 sub-markets (with the lowest psf rents being in Lavergne/Smyrna). Apartments in the NSM had an average 942 square feet.
It is not surprising then, that Madison and surrounding areas have become attractive as a relatively affordable location within an increasingly expensive regional rental market. That being said, NSM’s relative competitiveness is declining, since NSM rents have increased about 78% faster than those in the region as a whole.
Madison. Madison has a variety of rental housing options, with garden- style apartment complexes, senior & affordable high rises, and rental units or rooms in houses. Among the 25+ garden apartment complexes are Archwood Meadows, Fawnwood, Graycroft, Highland Ridge, Neely Meadows, Rothwood, and others. High rises include Madison Towers, Windlands East, Cumberland View Towers, Chippington Towers (I, II), Riverwood Towers, and others.
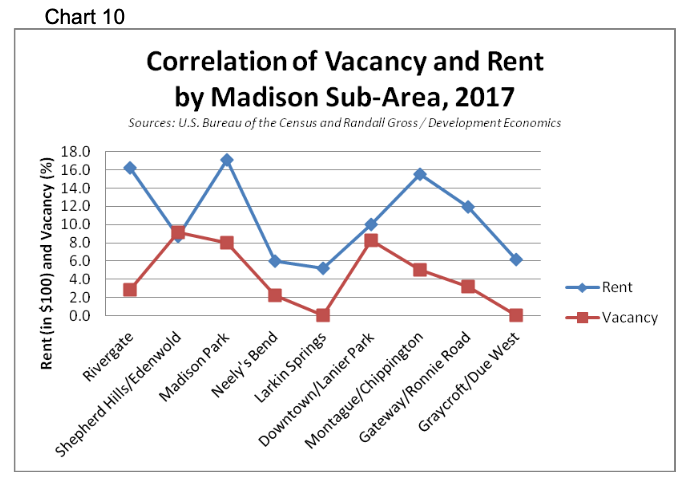
Madison occupancy rates have been increasing, although parts of the area lag behind. Based on the 2017 American Community Survey, the highest rental vacancy rates were found in the downtown area of Madison as well as Madison Park and Lanier Park. These areas exhibited vacancy rates ranging from 8.3% to 9.1%.
Rising occupancy has caused some apartment management companies to begin raising rents in Madison at a higher rate than is recent years. For example, Madison apartment managers reported in interviews that, with increased occupancy, they were raising their rents at a higher rate ($50 per month) than even one year earlier ($0-25 per month).
Madison’s median rents ranged from $567 in the Neely’s Bend area to nearly $1,000 in Rivergate. With a few exceptions, there appears to be a direct correlation between rent and vacancy rates in Madison, with areas that have high rents (Downtown, Madison Park, Lanier Park) also having relatively high vacancy rates. Notable exceptions include Rivergate, where rents are relatively high ($1,600 per month) but vacancy is low (only 2.8%). Clearly, renters see value for money at this location. This correlation was captured in the following chart.
There are a number of new housing developments planned or underway in Madison or in nearby areas that would impact on Madison’s housing market. These projects include a total of nearly 1,000 units if built out, not including development of a 130-acre Ryman Hospitality-owned site for mixed-use, directly across the river from Madison in Pennington Bend; mixed-use development of the former Miller-Motte College and Madison Square properties; or development of affordable housing projects proposed by Urban Housing Solutions and others. Another 218-unit project proposed off of Neely’s Bend Road was not approved. Nearby Broadmoor & Ben Allen TROD (321 units) and Bethwood Commons (77 TH) would impact on Madison’s housing market. Among the active residential projects planned or proposed in Madison are the following:
- Buffalo Trail Apartments (240 DU)
- Cheron Road Village Center (35 TH, 38 MF, 10 Lofts/Mixed Use)
- Bashaw Village Ph 2 (17 TH)
- Royal & Worth Streets (17 SF)
- Cherokee Trail Townhouses
- Bratville Road Townhomes (28 TH)
- Creative Way Village (81 Apt/TH)
- Creative Way (120 DU)
- North Marthona/OHB (13 TH)
- Chadwell (10 TH)
- East Campbell (75-80 SF/Cottage, TH)
Housing Market Area
The potential Madison Housing Market Area is disaggregated into two segments, a Primary Market Area (PMA) and Secondary Market Area (SMA). The PMA includes Madison and surrounding neighborhoods such as Inglewood and East Nashville, Dickerson Pike and other areas north of the river in Davidson County. The SMA includes more peripheral areas including Old Hickory and Hermitage, Donelson, Bordeaux, and Goodlettsville.
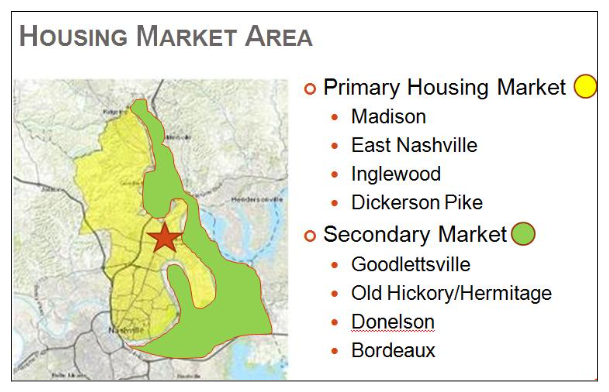
Aside from these local source markets, Madison competes for attracting a portion of the +/-25,000 people (10,000 households) who are moving each year to the Nashville area for work, family, retirement, and other reasons. There is also some inflow from outlying areas of Middle Tennessee, but more typically, the flow is in the opposite direction, with more people moving out of Madison to Lebanon, Mt. Juliet, Springfield, Hendersonville, Gallatin and other areas than are moving in to Madison.
Demographic Analysis
Detailed demographic analyses were conducted to access the baseline and projected demographic changes for the PMA, SMA, and inflow areas. Key findings from this analyses are described below. Aside from this demographic analysis, a separate economic assessment examined employment changes and projections to assess their impact on job-related relocations to the PMA, SMA and Madison specifically.
Household & Income Forecasts
The Primary Market Area (PMA) has a total of about 48,500 households and is expected to add nearly 3,000 within the next five years, to a total of 51,200. This number represents an increase of about 6.0% or roughly 1.2% per year over the five-year period. The largest number of households have incomes within the $50,000 to $75,000 range (close to the area median), slightly less than median income ($35,000 to $50,000) or have incomes below poverty level ($15,000 or less).
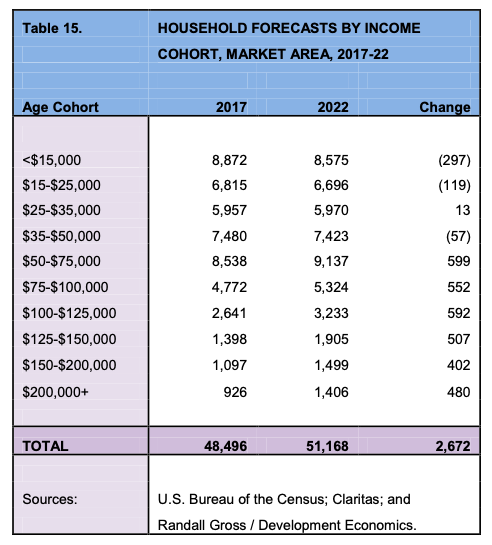
There will be roughly equal increases among all households having median household incomes above $50,000, with increases of 400 to 600 households in each income category. However, the number of households with incomes below $50,000 is projected to fall (except for those making $25,000 to $35,000). Some of that decrease is due to income inflation (since incomes are expected to increase with inflation), but as housing becomes more expensive within the PMA, it is likely that there will be fewer low- and moderate-income households that can afford to live in the area. Thus, their numbers will fall.
Age & Tenure
The PMA will add about 600 to 700 likely renter households and 2,000 to 2,100 likely homeowners over the next five years. There will be growth in all householder age cohorts except for those in the 25 to 34 age range, who happen to be the primary family builders. An associated reduction in new births will gradually impact on the number of school-age children and reduce demand for schools in the area, and is a reflection of national demographic cycles (as the large Millennial generation – children of the baby boomers – gradually age out of their child-bearing years). At the same time, there will be significant growth among 35 to 44 year-olds, as Millennials age into that cohort. Meanwhile, their baby boom parents aged 65 to 74 will remain key drivers in the housing market, as empty nesters will drive demand for smaller houses, condominiums and other housing products on smaller lots or in mixed-use developments in walk-able communities.
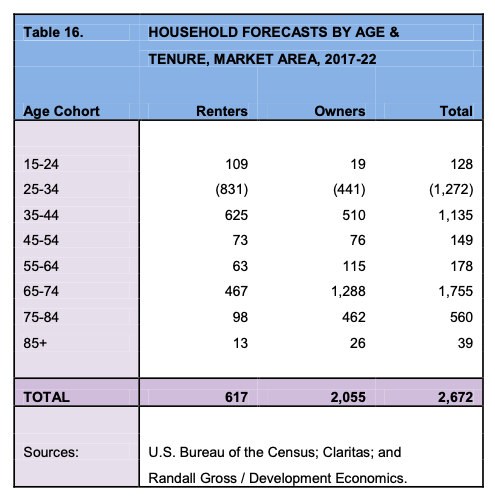
Ensuring that Madison offers housing products and environments that respond to demographic shifts favoring empty nesters and their Millennial children will be of paramount importance if Madison is to remain competitive as a housing market.
Employment Drivers
Employment will continue to drive demand for housing among those moving-up and relocating to the area from other locations. The Nashville area has added about 35,000 people per year for the past five to six years, of which about 25,000 are relocating to the area from elsewhere (including 4,000 to 5,000 immigrants). If the current rate of job creation holds up, Nashville will continue to attract significant numbers of in-migrants, even as the natural increase in population (births over deaths) slows with the aging of Millennials.
Davidson County Employment Forecasts
Davidson County is expected to add about 40,000 jobs over the next five years, yielding a growth rate of about 7.9% or 1.6% per year. Thus, job growth is expected to continue in the city (as well as throughout the region).
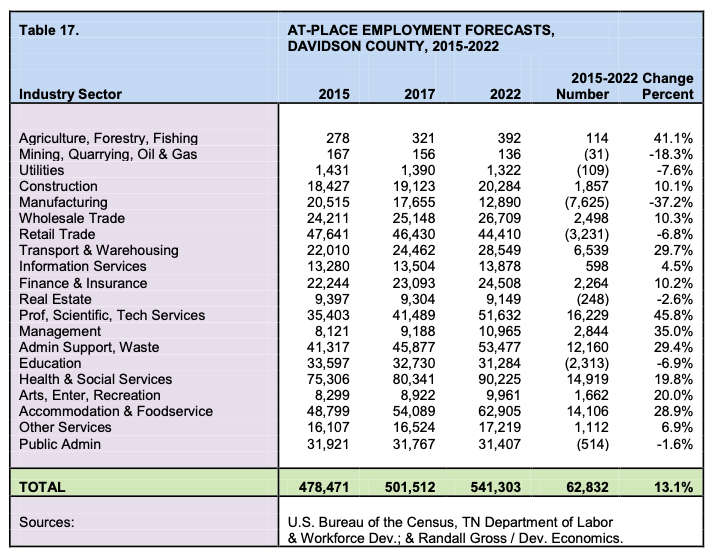
With regional unemployment rates falling below 2%, it is unclear as to whether there will be sufficient labor force growth to support this expected economic expansion (especially if there is a precipitous drop in immigration). But assuming that workers will continue to migrate to Middle Tennessee to support this growth, then there will continue to be employment-driven demand for housing.
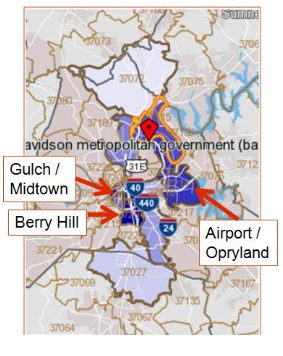 Much of the growth will be in health care, accommodation & foodservice, administrative support, professional & technical services, and transportation & warehousing jobs. Many of these job opportunities align closely with current workforce skills and employment trends among Madison householders. There will be decreasing employment opportunities in manufacturing and retail trade over the next five years. Madison’s at-place economic base is very dependent on retail trade.
Madison Resident Employment
As noted earlier in this report, Madison’s existing resident labor force is generally commuting in a north-south direction, with a concentration of jobs in Midtown/Vanderbilt, Airport/Opryland, Brentwood, and the Southeast Industrial Corridor area, not to mention Madison itself and the I-65- North Corridor. Berry Hill is home to Metro Schools, which employs a number of Madison residents at schools and facilities throughout Davidson County.
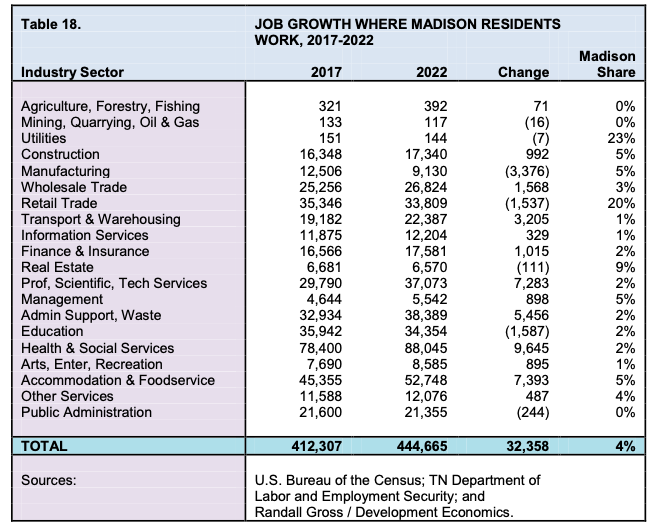
Employment opportunities will continue to expand by about 7.9% where Madison residents are most likely to work over the next five years, with a gain of about 32,400 jobs in those areas. The most significant gains will be in professional & scientific, health & social services, administrative support, and accommodation & foodservice jobs over the next five years.
Rental Housing Potentials
Based on an analysis of market-area demographic growth and employment-driven housing demand, Madison’s rental housing development potentials were forecasted in the competitive context through 2022.
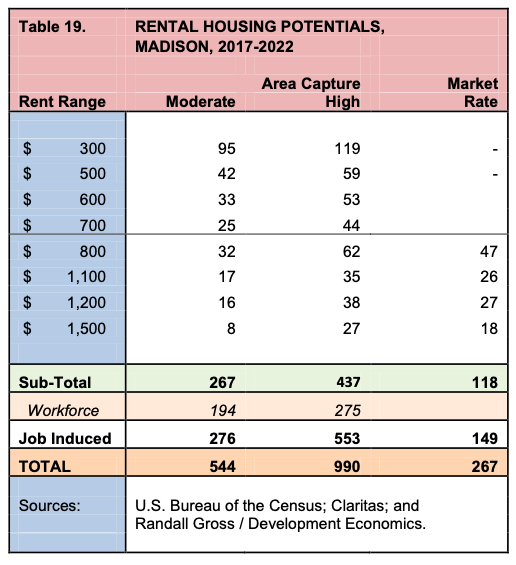
There is potential for a total of 540 to 990 rental units in Madison by 2022, including 275 to 550 job-induced units based on job growth projections in target industries and locations. These totals include 250 to 300 market-rate units and 290 to 700 affordable and workforce units. Affordable and workforce housing units would have rents in the $300 to $800 range based on the median incomes of Madison-area residents (as opposed to the regional Area Median Income or AMI). The forecasts already account for planned rental housing projects within Madison. It is assumed that proposed new light rail transit improvements would not be fully implemented to Madison within the next five years but that some new bus service improvements would be made along Gallatin Pike.
Rental Housing Products
Key housing product typologies that would appeal to the demographics of potential Madison renters are mixed-use, cottage community and artist housing. That being said, some renters in the market are desperate for affordable housing, and as such, are less discerning about the product. Most renters are likely to have preferences for a walk-able neighborhood with access to urban amenities including grocery, restaurants, coffee shops, parks and recreation facilities, among others.
For-Sale Housing Potentials
For-sale housing development potentials were also forecasted within the competitive market for Madison, based on demographic and employment growth among other factors.
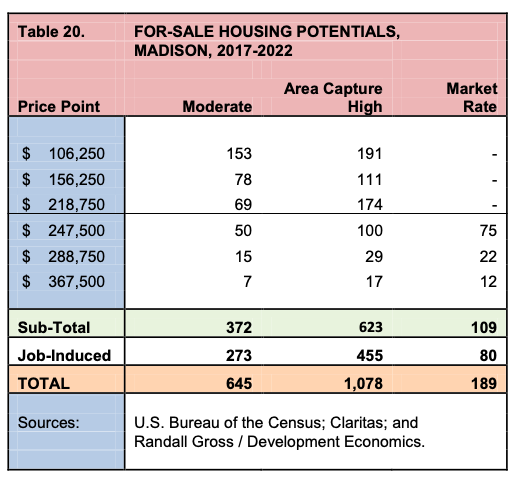
There is for-sale housing potential for 600 to 1,080 units in Madison by 2022. This number includes 275 to 480 job-induced units reliant on employment projections that could be impacted by any downturn in the national economy or by changes in policy that reduce regional job competitiveness. Again, it is assumed that light rail transit would not be developed to Madison by 2022 but that some service upgrades would be made along Gallatin Pike within the next few years.
Of the forecasted potential, there would be demand for 190 to 210 market- rate units and 400 to 800 affordable and workforce units. The affordable and workforce unites would be priced below $250,000 based on median Madison household incomes (rather than on the AMI). Thus, Madison resident move-ups would be a target market for such housing, affordable to many existing residents.
For-Sale Housing Products
Madison’s target markets would generate demand for a variety of housing products, including townhouses, cottage communities, HOA residential neighborhoods (“low-maintenance”), mixed-use (condominium), and artist housing. There is also continued demand for single-family detached housing, both existing and new. Ideally, new housing would be designed to reflect elements of the local architectural vernacular (e.g., mid-century or streamlined design, use of stone building materials, etc) that help to strengthen Madison’s residential identity. There are limited available locations for low-density housing, but areas in Neely’s Bend or along the river are best suited to low-density development.
Section 4. RETAIL MARKET ANALYSIS
A retail market analysis was conducted for Madison that focused on retail potentials within the Gallatin Pike Corridor but also looked at opportunities within other commercial nodes. Existing retail market conditions and context are examined, with a detailed assessment of Madison’s existing inventory and business mix. A retail trade area is defined along with other expenditure sources, and demographics and daytime employment are forecasted as a basis for determining retail demand. Madison’s retail business and development potentials are determined within the competitive context and a preliminary business mix is recommended as a basis for developing marketing concepts.
Existing Retail Market Conditions
Existing retail market conditions are examined in the broad market, with a more detailed examination of Madison’s existing inventory and retail business conditions, described below.
North Sub-Market Context
 Madison is part of the North Sub-Market (#9) for retail space, which had about 7.5 million square feet in 2017 or 13.2% of the 58 million square-foot Nashville market. Vacancy was at 6.2%, with about 480,000 square feet available in shopping centers tracked by Colliers International. Vacancy was about twice that of the market as a whole (which was down to just over 3.0%).
The sub-market comprised about 7.2% of total absorption and there was very little new construction, comprising just 0.9% of the Nashville market. Asking rents were also relatively low, at $21.00 per square foot, less than half of the overall market rate.
Gallatin Pike / Madison
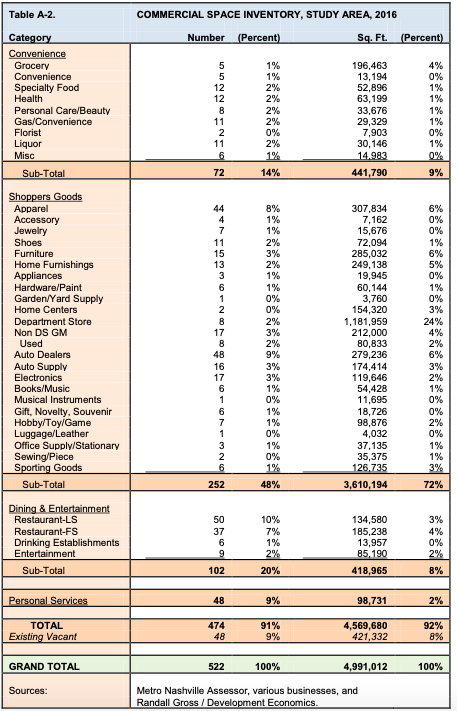
Based on a building-by-building inventory completed for this study, the Gallatin Pike Corridor in Madison has nearly 5.0 million square feet of retail/commercial space (accounting for two-thirds of the North Sub-Market). This inventory includes Rivergate Mall and 25 other shopping centers as well as individual businesses located on or near the Gallatin Pike Corridor within Madison.
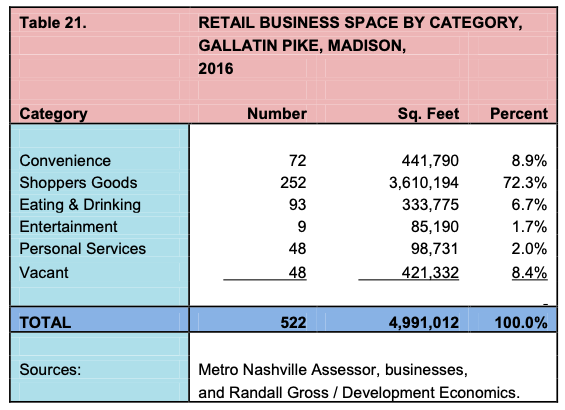
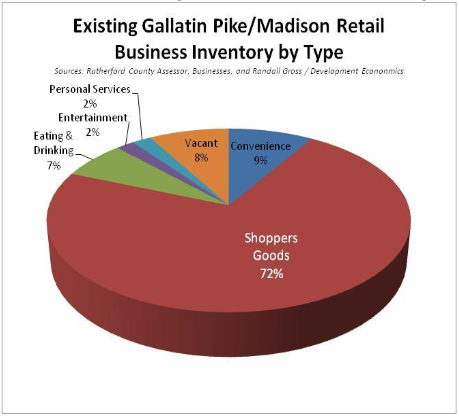 Nearly three-quarters of this space (3.6 million square feet) is in shopper’s goods businesses (that carry merchandise for which consumers comparison shop), a significant number that designates this corridor as a major shopping district in the region. About 9% is in convenience goods stores, 7% in eating & drinking, and 2% in personal services. Only 1.7% of the space is in entertainment. The overall retail vacancy rate is 8.4%, significantly higher than in the market as a whole as well as in the North Sub-Market.
The chart at right illustrates the extent to which shoppers goods stores dominate the Gallatin Pike Corridor. This category includes a broad range of businesses, from department stores to auto dealers, bookstores, toy stores, and various other retailers.
A detailed inventory by specific type of retail business is provided in the Appendix of this report. This inventory indicates that a significant share of retail space (24% or 1.2 million square feet) is in department stores. About 6% each is in automobile dealers, furniture stores, and apparel stores, with 5% in home furnishings. About 7% is in restaurants, with a larger number being limited- service (“fast food”) than full-service (“sit down”) restaurants.
Less-Desirable Business Concentrations. Gallatin Pike has large concentrations of businesses that the community has identified as being less desirable, including used car lots, auto repair, and auto parts suppliers (with all auto-related businesses accounting for 1.0 million square feet). This concentration of auto-related businesses is in part a holdover from Gallatin Pike’s heyday as the “Miracle Mile” for auto dealerships. While new car dealers are perceived as an acceptable use, the large number of auto-related businesses with large car storage lots facing onto Gallatin Pike has impacted negatively on the character of the corridor.
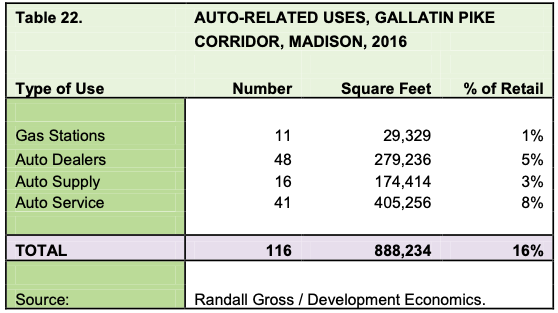
The corridor also has a large concentration of cash or payday loan businesses, accounting for more than 2% of all retail commercial space in Gallatin Pike. These businesses are perceived as preying on low-income residents who are locked into high-interest and high-pressure loans. While this perception does not always reflect reality, there is a minority of businesses that fulfill the community’s negative image of these businesses.
An estimated 40% of all businesses in Gallatin Pike offer primarily discounted merchandise. While discount stores are not, in themselves, perceived to have a negative impact, the preponderance of these businesses and the lack of available higher-end merchandising do impact on consumer image. Finally, there is nearly 30,000 square feet in about 10 tobacco stores, selling a product that has been shown to impact negatively on community health.
Business Operations. Interviews with businesses collected input and information on business operations, opportunities, and challenges facing businesses in Gallatin Pike. Based on information collected through these interviews, it was determined that Madison retail businesses are generally seeing sales increasing at 2.0 to 5.0% per year over the last five years. Nearly 30 Gallatin Pike businesses are Latino-owned and operated, mostly in the South Gallatin / Downtown Madison areas. None of these independent businesses are located in large shopping centers (where rents are steeper).
Retailers are generally satisfied with the existing discount-oriented mix and see little reason for change. But, they are impacted negatively by perceptions of crime and drug dealing, which keeps away some potential customers. Businesses draw from different source markets, depending on the type of business, but most draw from surrounding neighborhoods and only a few outside of RiverGate Mall and surrounding centers generate destination business.
Corridor Segments. The corridor is fairly segmented into the RiverGate Mall area, North Gallatin Pike, Downtown Madison, and South Gallatin Pike. While these segments lack identity branding, there are some distinctions that help begin to identity their unique characteristics and market functionality. These segments are described below in terms of their existing retail conditions and characteristics.
Gallatin Pike South. The area located between Briley Parkway and Old Hickory Boulevard forms the southern segment of the corridor. This segment has a total of 1.1 million square feet of retail/commercial space, of which about 10% is vacant. The business mix in this segment is oriented to general merchandise stores, supermarkets and other convenience, specialty food, fast- food restaurants, personal services, and culturally-diverse businesses oriented to the Latin-American market. Other than the latter, there are few specialty businesses or destination venues in this area.
The segment is anchored by Downtown Madison and Madison Square Shopping Center, both of which were at one time major regional destinations for shopping. In fact, Madison Square was the first large suburban shopping center in the region and eclipsed Green Hills is size and sales. Other major shopping centers in this segment include Due West Plaza, located at a major intersection of Due West Avenue and Gallatin Pike, with 158,214 square feet. This center is anchored by Dirt Cheap, Sav-A-Lot, Music City Thrift, Planet Fitness and CitiTrends. The center is heavily oriented to discount shopping and has succeeded in remaining fairly well occupied, with only 3.3% vacancy.
Also located in this segment is the former Kmart Center, a 118,119 square-foot center located at the major intersection of Briley Parkway and Gallatin Pike. At the time of its closing, the center had just 2.7% vacancy. This Kmart store was a casualty of the national chain’s asset shedding. The new owners of the site are looking at short term opportunities for leasing but also long-term opportunities for mixed-use redevelopment. The site provides excellent visibility and exposure to cross-town traffic at this location.
A more detailed analysis of Downtown Madison and Madison Square is provided below.
Downtown Madison. Downtown Madison, defined generally as that area along or near Gallatin Pike between Old Hickory Boulevard and Neely’s Bend Road, has a total of 146,000 square feet of retail/commercial space. Vacancy in this area is relatively high, at 12.3%.
Business Mix. The business mix is heavily oriented to pawn shops, hair supply, restaurants & bars, non-profit offices and convenience uses. There is relatively little in the way of shopping goods stores that would enable the district to regain its past as a downtown shopping district. Downtown Madison saw its market base for shopping erode over time due to the forceful combination of Interstate 65 (which diverted significant commuter and through-traffic away from Gallatin Pike) and RiverGate Mall (which created a completely new major shopping node to attract consumers from throughout northeast Davidson County, Sumner County, and beyond). Many of those consumers would have otherwise driven to Downtown Madison if not for alternative routes and destinations.
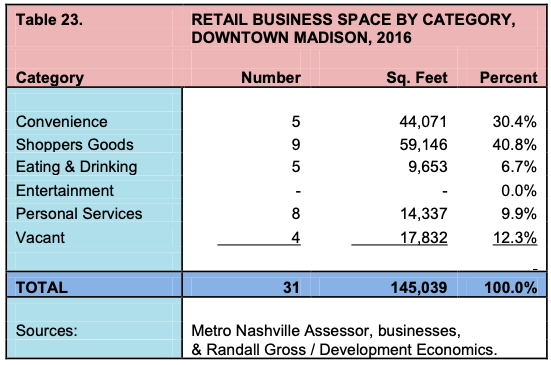
The lack of entertainment uses only exacerbates the issue with a lack of destination market flow. In a district heavily oriented to convenience uses, there is little incentive for shoppers from outside of the immediate area to venture into Downtown Madison.
Ownership. A large number of Downtown Madison businesses are owned and operated by immigrants. Owners’ nationality or ethnicity may have no relation to the target markets served by these businesses. For example, there is a business owned by Korean-Americans that sells hair products targeted to African-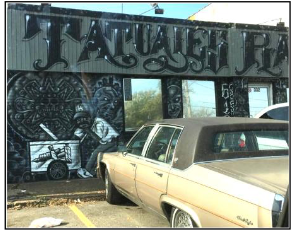 Americans. An Egyptian-owned business sells traditional “meat-n-three” meals to white American-born seniors. The cultural diversity of the ownership can be
a positive force for marketing and promoting Madison.
Conditions. Some of the businesses noted the negative impact of drug dealing on their business, since patrons will stay away from the area out of fear of running into drug dealers, even if they are not necessarily violent. Businesses, residents, and consumers have also noted the low-quality infrastructure and poor physical conditions in the area.
Downtown Madison suffers from a lack of branding, identity marketing, heritage preservation (with some older storefront facades covered over), centralized management, security and destination appeal. These issues will be 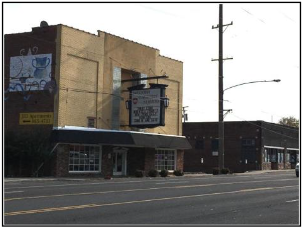 addressed in Part C: Strategic Recommendations portion of this plan.
Market Sources. On average, information gleaned from businesses suggests that 85% to 90% of sales are generated locally from within Madison despite the fact that Downtown Madison is a central business district and accessible part of a metropolitan market of 2.0 million people. Thus, the lack of destination merchandising, marketing and appeal has thwarted the district’s opportunities for diversification and expenditure capture. There are exceptions. At least one newer business does draw its customer base from throughout Nashville, Middle Tennessee, and beyond through a savvy marketing effort.
Madison Square. The Madison Square shopping center was built in 1955 as one of the region’s first suburban shopping centers and was, for some years, its largest. Longtime Nashvillians remember driving to Madison Square for destination shopping at Harvey’s Department Store and Tennessee’s first Shoney’s Restaurant. The 332,590 square-foot L- shaped center (including the separate cinema building at back) was 22.0% vacant in early 2017 (with an assumed 25% occupancy for the Halloween Express store). A vocational college (National College) and Aldi’s have since vacated space at the center and a “sea” of surface parking at front is often empty of cars. The center is occupied now by medical clinics, dollar stores, pawn shop, offices, personal services, a billiard parlor, and limited service. There is no retail anchor to drive demand for line shops and destination traffic. However, the current owners are now pursuing re- zoning and a master plan for redevelopment promoting mixed-use and transit-oriented development on the site based in part on the findings of this market analysis.
Gallatin Pike North. The area extending from Old Hickory Boulevard north to Dry Creek can be delineated as another segment of the corridor. This area has about 450,000 square feet of retail/commercial space, with 12% vacancy. The area was once marketed successfully as the “Miracle Mile” for its many automobile dealerships and other auto-related businesses. The Miracle Mile became a regional destination for auto shopping much as Downtown Madison and Madison Square had been destinations for apparel, department stores and other consumer shopper’s goods. Today, Gallatin Pike North retains many automotive businesses, but some larger dealers have closed or moved away and have been replaced by smaller used-car lots and second-tier auto-related businesses including repair shops, tire stores, and payday loan companies catering to the need for credit. Other businesses in this area include a number of convenience and home furnishings stores.
There are fewer traditional shopping centers in this segment of the corridor than in either the Rivergate area or the South Gallatin Pike segment. Among the largest in this area is Old Town Village, a 180,525 square-foot center with zero vacancy located just north of Old Hickory Boulevard near Downtown Madison. Old Town Village is anchored by a 107,000 square-foot Old Town Pottery store, with most other uses in services or fast food, rather than in retail stores.
Other large retail uses in this segment include the 49,700 square-foot Town & Country Food dealership, Northern Tool (25,600), Auto Zone (16,100), O’Reilly Auto Parts (11,900), El Rodeo Mercado Latino (11,100), Dollar General (10,900), and Auto Depot of Madison (10,000). Premier Global Production Company occupies the 51,000 square-foot former location of Camper’s Corner RV Center. The 28,350 square-foot former home of iconic Madison Bowl, vacant for many years, was recently designated one of the Nashville Nine (most threatened buildings) by Historic Nashville, Inc. The new owners are examining opportunities for restoring the facility as a destination entertainment venue that would bring bowling back to Madison.
Rivergate Area. This segment has by far the largest share of the corridor’s retail/commercial space, with 3.5 million square feet including the 1.2 million square-foot RiverGate Mall. The mall anchors this area, which extends from Dry Creek north to the Sumner County line. Much of the commercial development that has occurred in this area has spun-off from the mall’s development in the 1970s and reflects the destination character of a super-regional mall. The stagnation of the traditional mall format has had some deleterious impacts on surrounding retail centers, but the growth of Sumner County’s retail nodes has further eroded Rivergate’s market share. More detail is provided on RiverGate
Mall later in this section.
The segment exhibits the corridor’s lowest vacancy, at 7%. While vacancy is slightly higher than a healthy target of 5%, the relatively low vacancy indicates that the area remains relatively competitive for retail. Demographic growth within the broader trade area (extending through northern Davidson, Sumner, Robertson, and Wilson counties and up into Kentucky) continues to fuel demand despite the addition of competitive nodes in Sumner County. However, the demographic base supporting RiverGate Mall has comparatively lower household incomes and as such, the mall and surrounding retail centers have retained more discount merchandise stores and lower-end retail than their counterparts in new Sumner County centers.
This segment has a total of seven department stores, plus strong shopper’s goods (apparel, jewelry, specialty, furniture, home furnishings, etc), automotive, and an overall diverse mix representing most retail categories.
- RiverGate Mall. RiverGate Mall is anchored by Dillard’s, Macy’s, Sears, and J.C. Penney. Several of these department store chains are having financial difficulties nationally, so it is unclear what the future may bring to these units. The mall also has several other large stores and recreation centers including Smart Buys, Jumpstreet, and the new Guitar Center, all of which have over 10,000 square feet of space. RiverGate Mall has vacancy of 6.0%, which is relatively healthy for an aging, department store-anchored mall with a traditional format. However, as noted above, the health of its national anchors is increasingly in question and a share of the existing store mix is oriented to a discounted market.
- Other Large Centers. Among the other large shopping centers in this segment are the following:
| Name | Sq. Ft. | Vacancy | Anchor |
|---|---|---|---|
| Column Shoppes at Rivergate | 251,085 | 15.9% | American Signature |
| Rivergate Station | 234,837 | 1.8% | Conn’s, Burke’s |
| Marketplace @ Rivergate | 182,499 | 16.0% | Superpetz |
| Rivergate Square | 192,210 | 0% | Home Depot |
| Northside Marketplace | 191,049 | 10.5% | Dick’s, Best Buy |
| Village @ Rivergate | 181,896 | 2.0% | Target |
| McHenry Center | 168,735 | 12.9% | Hobby Lobby |
| Walmart Supercenter | 160,337 | 0% | Walmart |
Other Areas of Madison
There is some limited retail/commercial use outside of the Gallatin Pike Corridor, in other parts of Madison. However, this retail constitutes a relatively small share of the overall commercial inventory because of the preponderance of retail and commercial uses along Gallatin Pike.
Myatt Drive has 76,800 square feet of retail uses including the 20,500 square-foot America’s Motor Sports dealership, Dollar General, Advance Auto Parts, two gas stations, three convenience/tobacco stores, tattoo parlor, and others. But Myatt Drive is dominated by industrial and institutional uses, north of Anderson Lane.
East Old Hickory Boulevard (the original portion of Old Hickory before completion of State Route 45, nicknamed “Kitty Wells Boulevard”) has some 30,000 square feet of retail use but is dominated primarily by auto and other service uses east of Gallatin Pike through to Randy Road and beyond. Retail along this road is oriented to tire shops and other auto supply, personal services, discount tobacco, and other convenience food stores. Scattered retail businesses like Sidekicks Café on South Graycroft Avenue exist in several locations in Madison. One of the emerging retail opportunities may be the Cheron Road area on the west side of Madison, where some mixed-use development is planned near existing convenience use such as a Shell gas station.
Retail Trade Areas
Two separate retail market analyses were conducted for the purposes of this study. One examined the potential for retail in Madison, with a focus on the South and North segments of Gallatin Pike. The other focuses on the potential for retail in the Rivergate area, a larger regional destination draw. The two areas certain overlap, but they draw from somewhat different markets.
Madison – Gallatin Pike Trade Area
The Gallatin Pike Trade Area includes primary and secondary trade areas. The primary trade area, from which at least 70% of the market is drawn, includes the (A) Madison, (B) Hendersonville, (C) Gallatin, and (D) Old Hickory sub-areas. The secondary trade area includes (E) East Nashville & Inglewood, (F) Goodlettsville, Hermitage and the Dickerson Pike Corridor, among others. Basically, this trade area extends north along Gallatin Pike and Vietnam Veterans Parkway into Sumner County and into Goodlettsville.
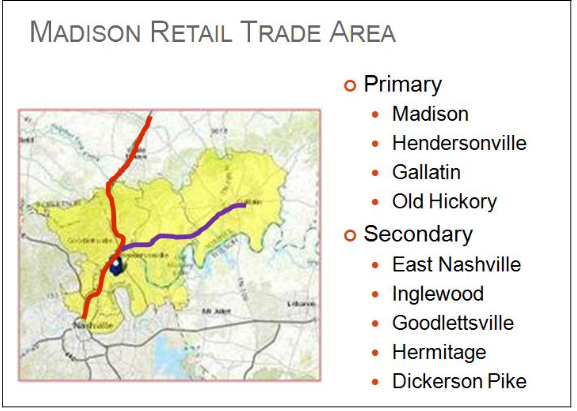
Madison – RiverGate Regional Trade Area
The regional trade area for Rivergate and destination sales includes the same area described above but extends further along I-65 into Robertson County, and to Allen, Simpson, Logan, and Warren counties in Kentucky. This market is fed by interstate traffic from the north and, to a lesser extent, from other parts of Nashville.
There would also be inflow from outside of these trade areas to Madison, accounting for 20 to 30% of sales. Inflow would increase with more destination uses to drive that market.
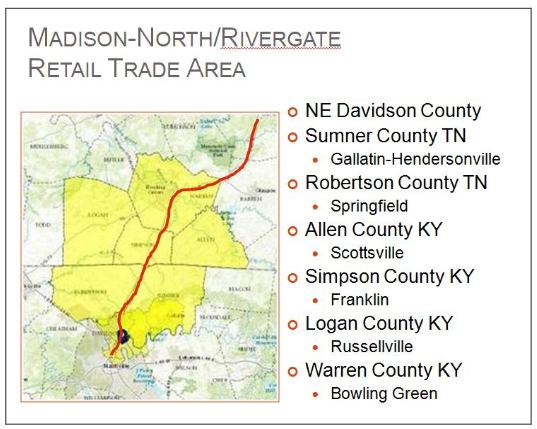
Demographic Forecasts
Demographic trends and forecasts were analyzed for both of the designated trade areas. Key factors including population, households and household incomes were examined, along with other factors like education levels and commutation patterns. Several basic findings from this demographic analysis are summarized below.
Madison-Gallatin Pike
The Madison-Gallatin Pike Trade Area has generally seen increasing demographic indicators, including increased household base, income, population, and education levels since 2000. The only exception is that within Madison itself, household incomes actually fell between 2000 and 2017, after accounting for inflation. In other words, Madison (sub-area A) incomes did not keep up with inflation during at least part of that period, although there has been growth in recent years. Trade Area demographic trends are summarized in the Appendix of this report.
Over the next five years, population, households and income will continue to increase throughout the trade area (sub-areas A-Madison, B-Hendersonville, C-Gallatin, D-Old Hickory, E-East Nashville/Inglewood, F-Goodlettsville, Hermitage, and the Dickerson Pike Corridor. Overall, trade area population will increase by 24,700 or 10.5% to 260,000. The number of households will increase by 20,590 or an even faster rate of 24.4% (4.88% per year) to 105,020. Average household incomes currently average $ 51,700 in the trade area but are expected to rise by $1,680 or 3.2% to $53,400 by 2022.
Population and households will increase fastest in the Gallatin area, at 8.2% and 8.7%, respectively. There will also be rapid growth in Hendersonville (7.2%, 7.4%). The slowest growth will occur in East Nashville (4.6%, 5.4%), mainly due to the fact that this is the most built-out portion of the trade area and there is less likely to be large residential developments, especially in historic districts. Even so, that sub-area will experience household growth exceeding 1% per year, suggesting that there will be continued housing development even there. Households will grow somewhat faster than population in East Nashville because of the smaller household size in that area (singles and couples with no or fewer children). As noted earlier, some families with school-age children may be moving out of Davidson County.
Madison has the lowest household incomes within the trade area, at only $38,200. Yet, household incomes are projected to rise fastest within Madison itself, where incomes will increase by $1,700 or 4.5% from $38,200 to $39,900. A significant reason for this increase is the influx of higher-income households such as those moving from East Nashville or other areas into Madison. Even a relatively small influx of higher-income households will pull the average income higher in Madison.
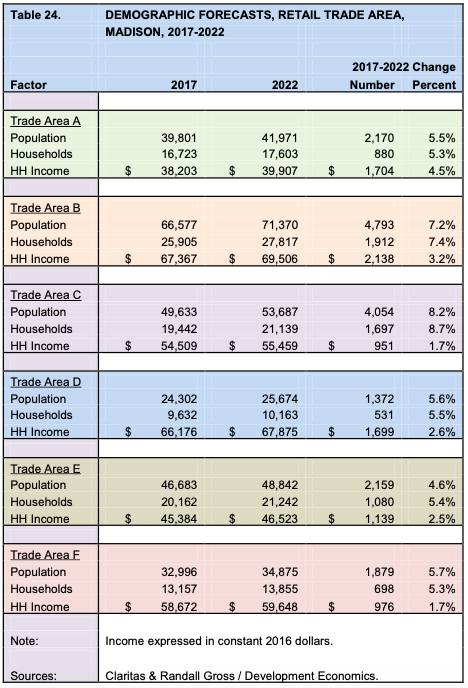
There will be slower but still healthy income growth in Gallatin, East Nashville, and Old Hickory over the next five years.
Madison-Rivergate
The Madison-Rivergate Regional Trade Area has also seen growth since 2000, albeit at a slower pace than within the Madison-Gallatin Pike Trade Area The Rivergate Trade Area gained 47,200 in population (9.1%) and 47,700 in households (28.0%). Thus, household growth greatly exceeded population growth, suggesting that the area is seeing an influx of smaller, younger households with fewer children. Household incomes increased moderately in the area, rising at 2.1% above inflation. Household incomes in the trade area average $50,000 at present. Forecasts through 2022 are provided below.
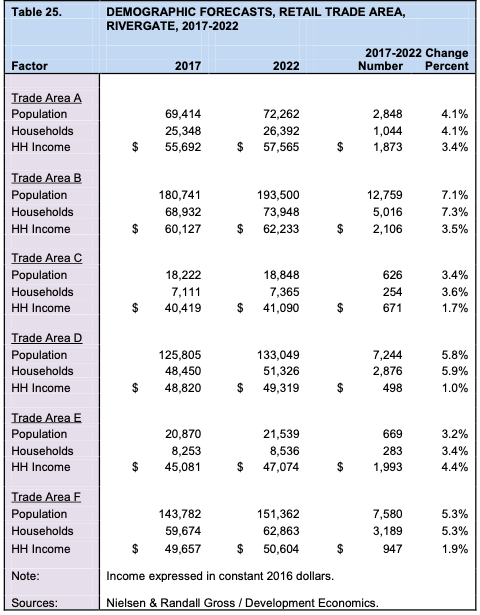
All of the trade area is expecting growth over the next five to seven years. Overall, trade area population will increase by 31,700 to 590,560, an increase of 5.7%. The household base will increase by 12,700 or 5.8% to 230,430 by 2022. Overall household income will increase to $54,410, an increase of $1,400 or 2.6% over the five-year period.
The fastest growth will be in Sumner County (sub-area B), which will add 12,800 people (or 7.1%) and 5,000 households (7.3%). Allen County, Kentucky (Sub-area E) will see the fastest income growth, at 4.4% over the five-year period. But Allen and Simpson (Sub-area C) counties in Kentucky will also have slower population and household growth. Robertson County (A), Warren County (D), and north Davidson County (F) will see moderate demographic growth. Davidson County will have relatively slow income growth compared with most of the other areas, with the exception of Simpson and Warren counties.
TPI & Expenditure Potential
Total Personal Income (TPI) represents the cumulative income of all households within the trade area. TPI and the amount spent on retail goods and services (expenditure potentials) are both expected to increase in both the Madison-Gallatin Pike and Rivergate trade areas over the next five to seven years.
Madison-Gallatin Pike
The Gallatin Pike trade area will see 9.5% growth or the addition of $544.6 million in total personal income over the next five years.
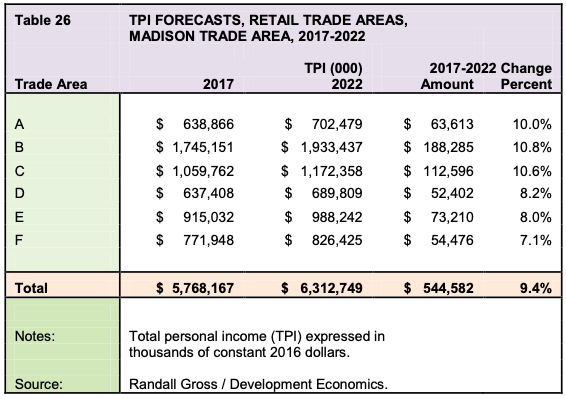
Growth in total income will translate into growth in retail expenditure potential of $392.7 million by 2022. This means that households within the Madison trade area will generate nearly $400 million more in retail sales by 2022 due to the combined effect of growth in households and growth in household incomes. The most significant growth will be in Gallatin and Hendersonville, while the Goodlettsville area will experience the slowest growth in expenditure potential.
Madison-Rivergate
The Rivergate trade area will also see growth over the next five years, adding almost $1.0 billion in additional income and $729.1 million (8.6%) in retail expenditure potential by 2022. As a result, trade area retail expenditure potential will reach $12.5 billion.
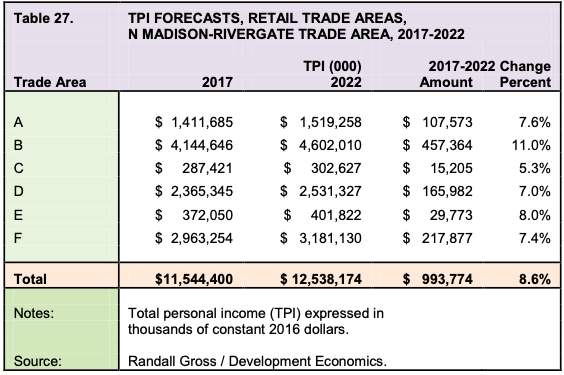
The fastest and most significant growth will be concentrated in Sumner County, with the slowest growth in rural Simpson County, Kentucky.
Employee-Generated Demand
Based on Census estimates and office inventory data, the study area has a total of about 7,240 office workers. This number is expected to increase by about 1.0% by 2022, generating demand for retail goods and services. Using data indicating average retail expenditures per office worker for different types of goods and services, the total employee-generated retail expenditure potential was forecasted for the study area. Demand generated by office workers is important in supporting the market for restaurants and other retailers during the work day. A summary of findings on office employee retail expenditure potential is provided below.
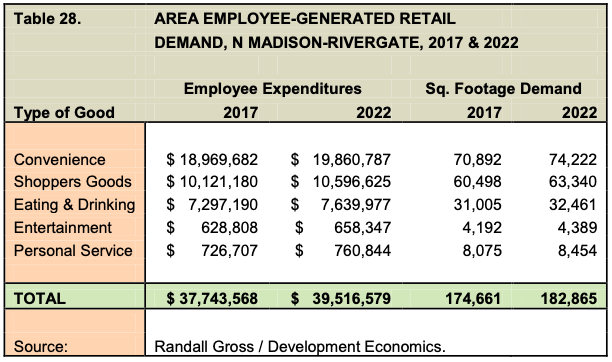
Madison’s office workers generate an estimated $37.7 million in retail expenditures at present. That number is expected to increase by about $1.8 million to $39.5 million by 2022.
Madison Retail Potentials
Madison’s capture of trade area retail demand was determined within the competitive market. There continues to be growing competition to Madison, in the form of new retail development in suburban Hendersonville and Gallatin, Mt. Juliet, and other areas in addition to retail development in East Nashville, downtown, Green Hills, and other nodes within Nashville.
Madison South – Gallatin Pike
The market analysis determined that Madison and the Gallatin Pike Corridor will continue to have an oversupply of 110,000 to 120,000 square feet f retail space by 2022. This oversupply results from the fact that even with increased expenditure potential, it is insufficient to overcome increasing competition and existing vacancy within the market. However, the detailed analysis also found that, while there is an apparent oversupply in certain retail categories (liquor, dollar stores, auto-related businesses, electronics, fast food restaurants), there is still potential for growth in other categories like home & garden stores, books & music stores, hobby/toy and game stores, miscellaneous shoppers goods, restaurants, and entertainment. These findings are summarized below by primary sector and detailed in the Appendix by specific retail business category.

As indicated above, there is gross demand for about 51,400 square feet of retail space in the corridor, but there is also 162,800 square feet of existing vacancy, so there is net over-supply of 111,400 square feet. The oversupply is concentrated in convenience stores, personal services, and limited-service (fast food) restaurants, but there is still significant potential for entertainment (50,000+ square feet), shopper’s goods (13,100), and full-service restaurants (<10,000 square feet). Again, the findings by detailed retail business category are shown in the Appendix.
Madison North – Rivergate
The market analysis for the Rivergate area found that there is also an oversupply of retail space, forecasted to be 300,000 to 350,000 square feet. Again, the oversupply applies to certain categories, including certain shopper’s goods, auto-related businesses, electronics, and fast food restaurants. There is net potential for specialty food / groceries and convenience stores, hobby/toy & game stores, books & music stores, full-service restaurants, and entertainment venues.
As shown below, the Rivergate area has an over-supply of about 190,000 square feet of retail space. But that amount, coupled with the 162,900 square feet of vacancy, yields a total over-supply of more than 350,000 square feet of retail space. The oversupply extends to the shopper’s goods category, as well as to limited-service restaurants and personal services. There is net demand for more than 120,000 square feet of convenience goods store space and nearly 70,000 square feet of entertainment space, in addition to some net demand for full-service restaurants. The detailed findings by specific business category are provided in the Appendix of this report.

Ultimately, both of these market analyses have found that the corridor and Rivergate are over-supplied for retail but that the mix is not maximized within the existing space. In other words, there is demand for diversifying the retail mix and strengthening its destination potential through entertainment, full-service restaurants, and shopper’s goods or convenience at certain locations (namely Downtown and lower Gallatin Pike for the former and Rivergate for the latter).
Recommended Retail Mix
Based on the findings of the retail market analyses, recommendations are made with respect to strengthening the business mix at certain key locations. These recommendations form the basis for retail marketing, business recruitment and development strategies for Madison that are discussed in the Part C Report. The business mix recommendations are disaggregated for several key nodes, below.
Downtown Madison
Downtown Madison is under-developed as a retail node and provides significant opportunities for drawing and capturing a destination market because of its central location, historic and civic function, urban format, and heritage building stock. The addition or replacement of about 132,000 square feet of retail use is summarized and described below.
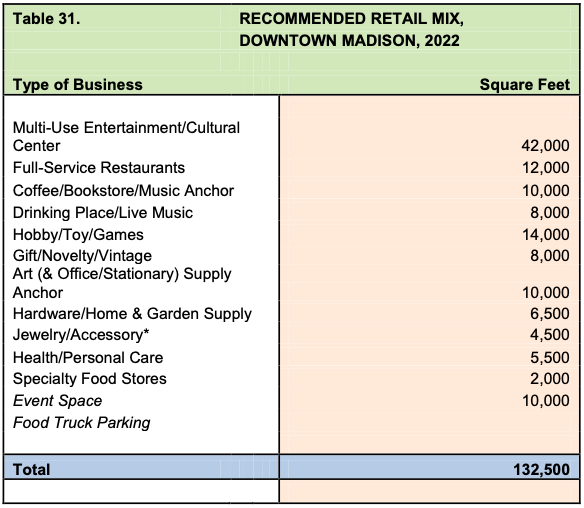
The recommended business mix for downtown Madison is oriented to enhancing the area’s destination potential. The key driver for this mix would be the integration of up to 42,000 square feet of entertainment, in the form of one or two major venues or a group of smaller venues integrated into the Downtown and areas nearby. Ideally, entertainment would comprise of venues offering live music and music-related experiences, because of Madison’s historic and current role as a home to musicians and a node in the region’s musical heritage and tourism. Music and entertainment in nearby venues such as Madison Bowl would also help strengthen the destination draw in the downtown area. Development of a cultural center associated with the music venue would also be advised.
 Up to 12,000 square feet of full-service restaurants offering ethnic or specialty menus would work well with the mix oriented to live music and music-themed activities, cultural activities and associated venues.
A destination coffee shop / bookstore anchor would be a key element of the downtown mix, not only to enhance destination appeal based on market support, but also because the local community has stated a need for “gathering places,” and venues where Madison’s diverse population can come together. A template for this type of establishment exists in the form of Busboys and Poets, a local Washington, D.C.-based chain of coffee shops that also incorporate book sales, live music, poetry readings, art shows, and community-based events. In Madison, there is scope for development of a similar model that can become a destination for patrons attracted from other areas of the city.
The downtown area could also attract hobby, toy, and game stores, whether as an independent anchor or several smaller specialty shops. Often, small game stores become regional destinations if they offer playing pieces and meeting space for a game that cannot be found anywhere else in the region. An art & office supply anchor of 10,000 square feet would also be supported as part of this retail mix. Given that Madison is home to Nossi College of Art and many artists and musicians, there is the opportunity to capitalize on the market and support the artist community.
Other uses supported in the market include drinking places with live music, gift/novelty and vintage stores, independent hardware and home & garden supply, jewelry & accessory stores, health & personal care stores and ethnic/specialty food stores.
While not tested by the retail market analysis per se, there is also the opportunity for an event space (of possibly 10,000 square feet) to accommodate fundraisers, meetings, and local events not otherwise accommodated in music venues or other facilities in the downtown area. Finally, Downtown Madison is ripe for food truck parking, particularly if more residential and office uses are integrated into the downtown mix.
South Madison
The southern portion of Gallatin Pike offers additional opportunities for diversifying and strengthening the retail mix. The departure of Kmart from a high-exposure site at Briley Parkway and Gallatin Pike provides a critical site for integrating new, more diverse retail options. This segment of the corridor could accommodate more convenience uses including specialty groceries, health & personal care stores, and miscellaneous convenience retail. Certain shopper’s goods stores are also supportable within this segment, including apparel & accessory stores and electronics businesses. Finally, there is the opportunity for small eating & drinking establishments like sandwich and coffee shops. Certainly such retailers could also be accommodated in the downtown area, but mixed-use development of the Kmart site would create opportunities for establishing a smaller, more walk-able node at that location than what had existed before.
Rivergate Area
A key objective for Rivergate would be to update the retail format and strengthen the destination draw of the mall and surrounding commercial node. There are opportunities here for a family entertainment center or similar venue of 40,000 square feet. The market also supports development of specialty food stores or groceries on the order of 25,000 square feet. The market also supports development of “destination” restaurant(s) of up to 8,000 square feet.
There is also the opportunity at Rivergate to recruit niche businesses that do not otherwise exist in the regional market, or at least within the North Sub- market. An example would be an Apple Store. While there is a store in Green Hills, there is no Apple Store north of the Cumberland River or in southern Kentucky. So, having such a store would provide a destination draw for the Rivergate node. The recommendation is to recruit several of these unique destination retailers to the area to strengthen regional capture. These recommendations provide the basis for more specific development, marketing, and business recruitment concepts described in the Part C Report.
SUMMARY OF MARKET FINDINGS
The following summarizes the findings from the Market Analyses for housing, retail, office and industrial uses in Madison. The market analyses provided input to the overall Strategic Plan prepared in 3 parts for the community.
Housing
The housing market analysis forecasted potential for both rental and for- sale housing in Madison through 2022. Key findings are summarized below.
Rental Housing
There is potential for development of 540 to 990 rental housing units in Madison, including 250 to 300 market-rate units (generally renting from $800 to $1,600) plus 290 to 700 “affordable” and workforce units (renting for $350 to $800 per month based on the median incomes of Madison residents.
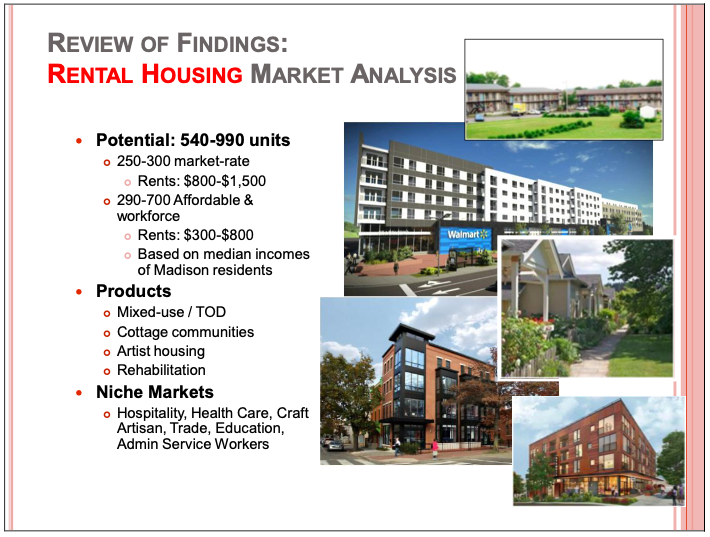
The target rental housing products include mixed-use, cottage, and infill multi-family units, plus rehabilitation of older existing apartments. Niche Madison rental markets include Midtown, Madison, and Airport/Opryland-area workers in the hospitality, health care, artisan, trade, education, and administrative services industries.
For-Sale Housing
There is potential for 190 to 210 market-rate for-sale housing units in Madison ranging in price from $350,000 to $750,000. Madison could also capture demand for 400 to 800 affordable and workforce housing units priced below $300,000 based on the median household incomes of Madison residents.
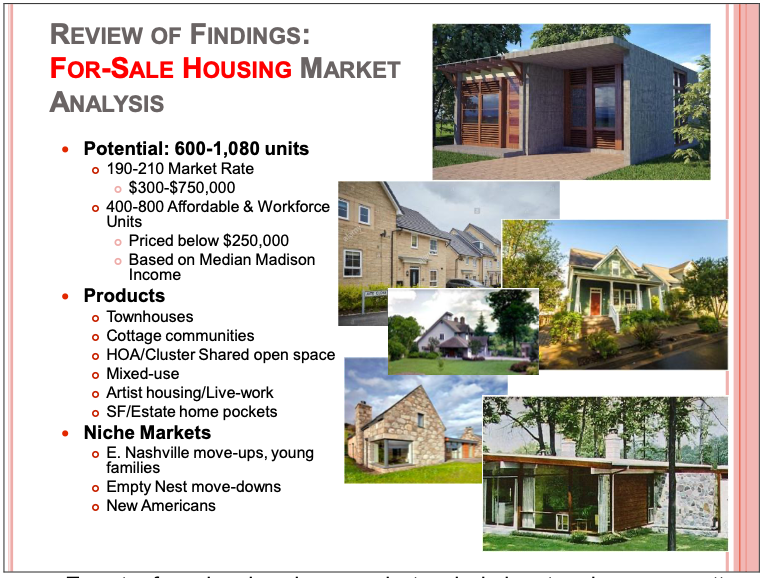
Target for-sale housing products include townhouses, cottage communities, HOA/Cluster (“low-maintenance”) communities, mixed-use, artist housing, and pockets of single-family detached estate homes. Niche markets for these products include East Nashville move-up singles and couples, empty nest move-downs, and New Americans. Young families would naturally be drawn to Madison but for negative perceptions of area schools. Many of those families are moving to suburban jurisdictions in other counties just as their kids reach school age.
Retail
The retail market analysis determined that there is an oversupply of 100,000 to 120,000 square feet in south/central Madison (south of Dry Creek) and 300,000 to 350,000 square feet in north Madison / Rivergate. This oversupply will persist despite continued demographic growth in the respective trade areas, which extend into southern Kentucky.
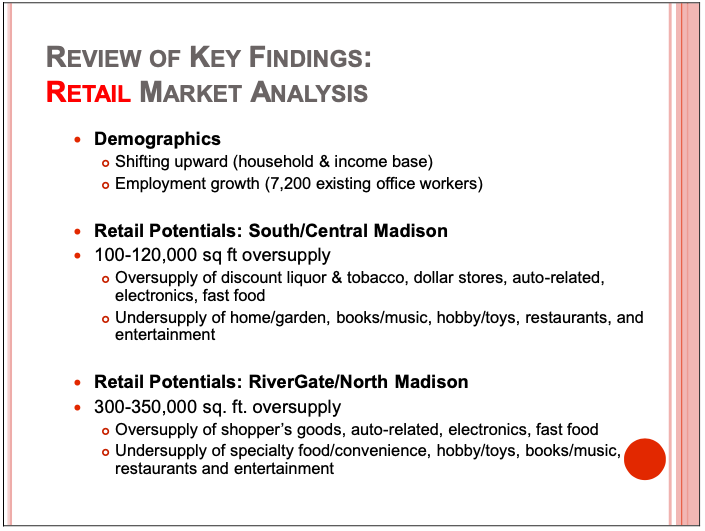
The over-supply is especially pronounced in retail categories like discount stores, liquor & tobacco, auto-related businesses, electronics, and fast food. Meanwhile, there is healthy demand for home & garden supplies, books & music stores, hobby/toys & game shops, full-service restaurants, and (especially) entertainment. The Rivergate area is undersupplied for groceries and specialty food stores. Ultimately, there is an issue with the current business mix, which is too heavily oriented to discount merchandise, automotive, and fast food restaurants. Where demand exists for new retail, it is oriented to diversification of the business mix and concentration of retail in key nodes including Downtown Madison and the Rivergate Mall area as described below.
Downtown Madison
A retail business mix with 132,000 square feet of new business development is recommended for Downtown Madison, based on the findings of the market analysis. This business mix is anchored by entertainment uses, especially those oriented to celebrating Madison’s musical heritage. Full-service restaurants, coffee/bookstore, drinking places, gift and vintage shops, art supply, hardware/garden supply, health & personal care, and cultural/event spaces are recommended as part of that mix. Ultimately there is an emphasis recommended on dining, arts & culture and entertainment (especially live music), with specialty and Madison-branded merchandising as part of a mixed-use environment.
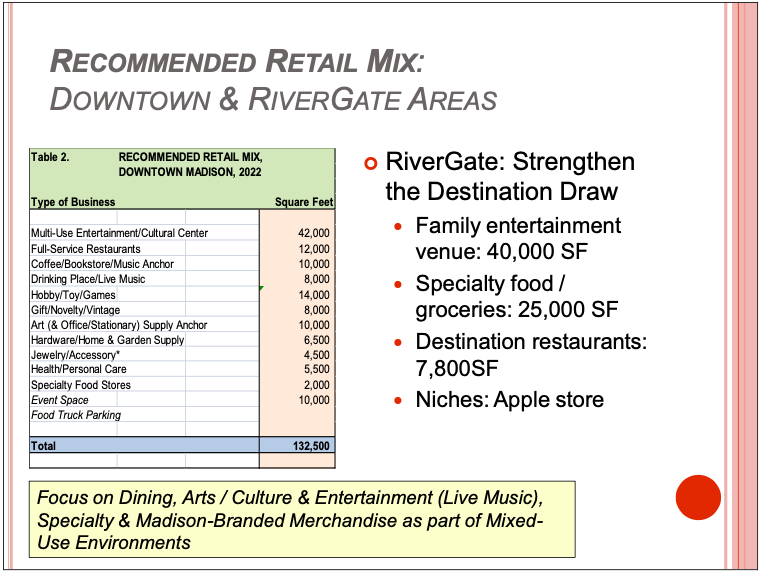
The recommended business mix for Rivergate is oriented to strengthening the destination draw of the mall and surrounding commercial district by integrating more family entertainment venues, specialty food and grocery stores, destination restaurants and unique niche product stores that otherwise do not exist in the Nashville market (or at least in areas north of the Cumberland River into southern Kentucky).
Office
The Madison office market is tempered by the fact that Madison itself lost 30% of its job base (5,200 jobs) since 2002, and the Madison area represents just 0.34% of Greater Nashville office market activity. Despite certain constraints, Madison does offer potential for up to about 45,000 square feet of new office development by 2022.
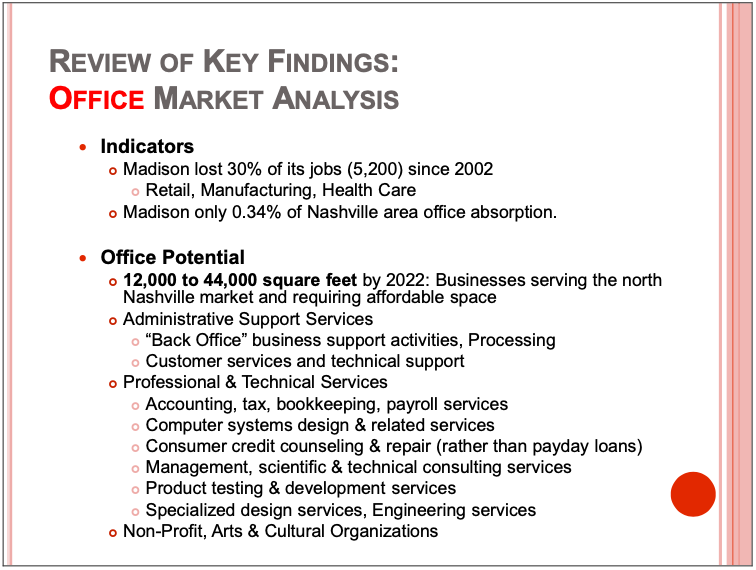
The Madison office opportunity targets businesses servicing the north Nashville market and requiring affordable space. Among the target business sectors for office space in Madison would be administrative support services (back office, customer & technical support), professional & technical services (accounting, computer systems, credit counseling, management, product testing & development services, and design engineering services), and non-profit arts & cultural organizations, among others. Affordable high-quality space with good regional access is an opportunity in Madison.
Industrial
Madison’s industrial market is highly concentrated along the Myatt Drive Corridor, with a smaller concentration along the railroad. The industrial market analysis forecasted potential for 65,000 to 78,000 square feet of industrial development in Madison over the next five to seven years assuming Madison captures its “fair share” of market demand. However, if Madison is pro-actively marketed for industrial recruitment, the community could potentially capture demand for 160,000 to 310,000 square feet.
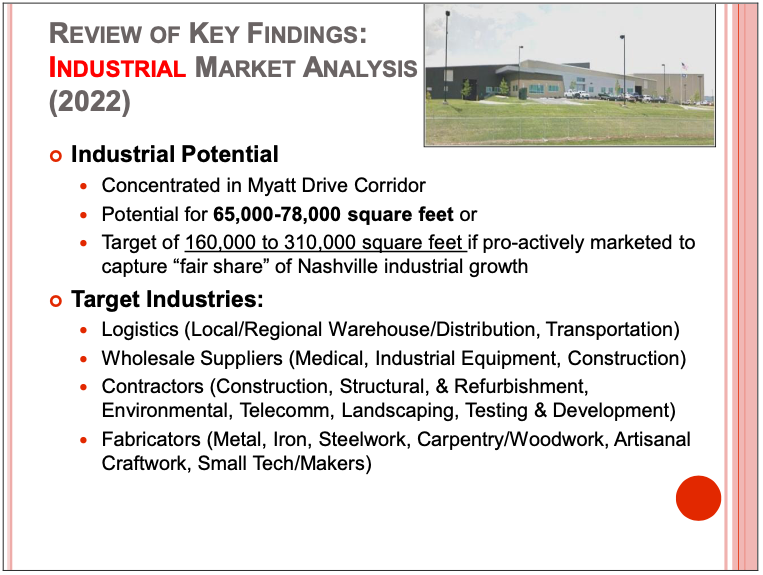
Target niche businesses for Myatt Drive and Madison include logistics companies (warehouse/distribution, transportation), wholesale suppliers for medical industrial equipment, and construction, contractors (construction, structural, environmental, telecomm, landscaping and testing & development), and certain fabricators (steelwork, carpentry/woodwork, and artisanal (“maker”) craft.
Appendix
SELECTED LARGE OFFICE BUILDINGS IN MADISON
| Building Name | Sq. Ft. | Sample Tenants |
|---|---|---|
| Due West Towers* | 560,000 | Pavilion Church, Vacant |
| Briarville Business Center | 27,061 | St. Thomas-Premier Radiology |
| Due West Building | 25,069 | Jackson Family Dental, Due West Family Health |
| 2101 Gallatin | 24,534 | Benfield Pet Hospital |
| Rivergate Park Office Bldg | 24,495 | Broker HQ, Cobb & Waites Anesthesia, Rivergate Chiro, State Farm Insurance |
| 1717 Gallatin | 23,555 | Concentra Urgent Care |
| 520 Lentz Drive | 22,391 | United Fellowship Center |
| 620 Gallatin | 21,678 | Centerstone Medical Clinic |
| Madison Office Bldg | 19,260 | Bluegrass Medical Billing, Hall & Sitler, NOVO |
| 113 Cumberland Avenue | 16,700 | Vacant (Available) |
| 911 Madison Square | 15,420 | Agape Healthcare |
| 820 Madison Square | 15,400 | CSL Plasma Center |
| Lawyers Building | 11,874 | HUGGS, Comfort Keepers |
| 605 West Due West Avenue | 9,708 | DCI Dialysis Clinic |
| 231 OHB | 8,160 | Madison Family Dentist |
| Medical Dental Building | 8,093 | Swauger Dental |
| 2106 Gallatin | 7,475 | Star Physical Therapy |
| 1570 Gallatin (RiverGate Sq) | 7,300 | Rivergate Village Dental |
| 601 Due West Avenue | 7,088 | United Neighborhood Health |
| 115 Gallatin | 6,608 | Tax Services |
| 500 Gallatin | 6,598 | Atlas Rental Cal |
| 989 Gallatin | 6,500 | Bank of America |
| 813 RiverGate Parkway | 6324 | Castle Dental Office |
| 900 RiverGate Parkway | 5,924 | Regions Bank |
| 202 Gallatin | 5,549 | SunTrust Bank |
| 742 RiverGate Parkway (RGP) | 5,491 | Home Instead Senior Services |
| 913 Gallatin | 5,040 | Serenity Healthcare |
| Professional Building | 5,030 | Vacant, Tax Services |
| 111 Old Hickory Boulevard | 5,000 | Vacant |
| 917 RiverGate Parkway | 5,000 | Tennessee Credit Union |
* Purpose-built as a hospital but being marketed now primarily for office use.
